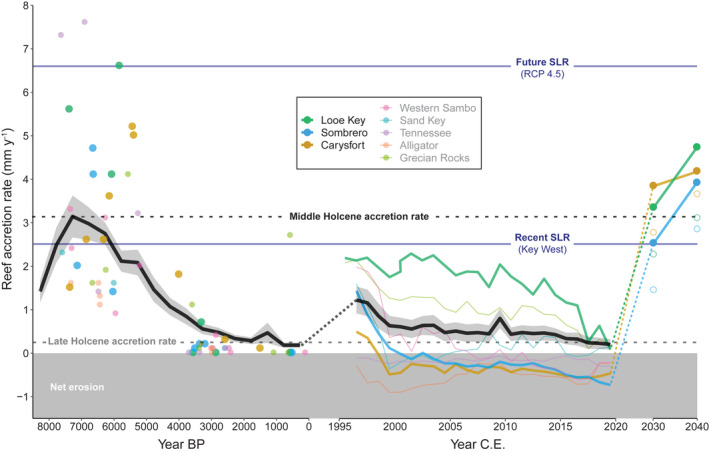
FIGURE 4.

Estimates of past, present, and future reef accretion in the Florida Keys. Reef‐accretion potential estimates from this study (colored lines in middle panel) are compared with rates of reef accretion during the Holocene (8500 years before present [BP] to ~1950, which is the limit of radiocarbon dating and designated as “0” in this plot) reconstructed using reef cores (points in left panel; Toth, Kuffner, & Stathakopoulos, 2018) for sites that were evaluated in both studies. The dashed black line between the Holocene and the carbonate budget reconstructions highlights the ~1 mm year−1 difference between historic accretion estimates from geological versus ecological data. This difference is used to define the lower uncertainty (open circles) of the future accretion projections. Regionwide mean (black line) ± standard error (SE; gray shading) trends in reef accretion for both time periods are also plotted. Mean rates of reef accretion during the peak of regional reef accretion in the Middle Holocene (~7000 BP) and after reef accretion largely terminated ~3000 BP (Late Holocene) are indicated by horizontal dashed lines. Past changes are compared with projected increases in mean reef‐accretion potential under future coral‐restoration scenarios based on the 10‐ and 20‐year coral restoration targets of the Mission: Iconic Reefs initiative at three reefs (Table S4; NOAA, 2021). Filled circles represent optimal estimates of future reef‐accretion potential, whereas open circles account for the estimated ~1 mm year−1 erosion not quantified by the budgets. Trends in reef accretion are compared with mean rates of recent sea‐level rise (SLR; https://tidesandcurrents.noaa.gov/, station ID: 8724580 [Key West]) and projected rates of future (to 2100) SLR under Representative Concentration Pathway 4.5 (Perry et al., 2018) for the Florida Keys (horizontal blue lines).
