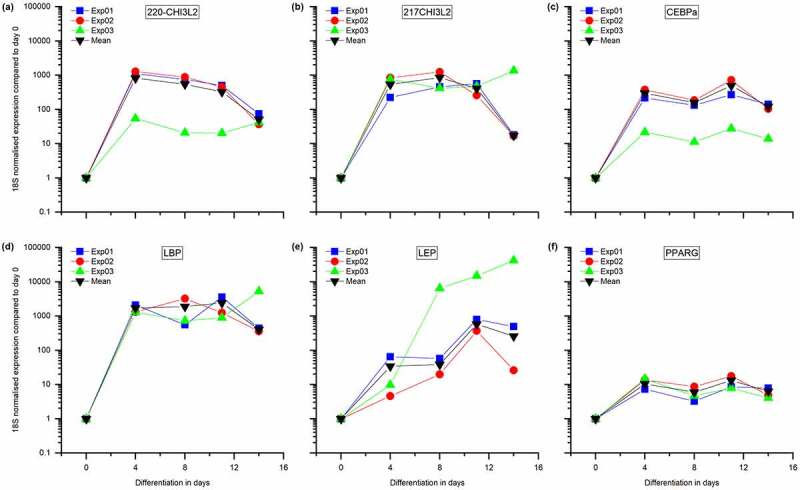
Figure 7.

Gene expression analysis during SGBS cellular differentiation.
Legend: Triplicate qRT-PCR results from markers of cell differentiation genes: panels (a) CHI3L2-220, panel (b) CHI3L2-217, panel (c) CEBPA, panel (d) LBP, panel (e) LEP, and panel (f) PPARG; the triplicate experiments (exp) are labelled 01 (blue), 02 (red) and 03 (green) and the fourth curve in black (downward triangle) is the mean. The CHI3L2 qRT-PCR assays targeted exons 6–7 (panel a:220-CHI3L2) and exons 3–4 (panel b:217-CHI3L2) using Thermofisher TaqMan® gene expression assays ID Hs00970220_m1 and Hs00970217_m1 respectively.
