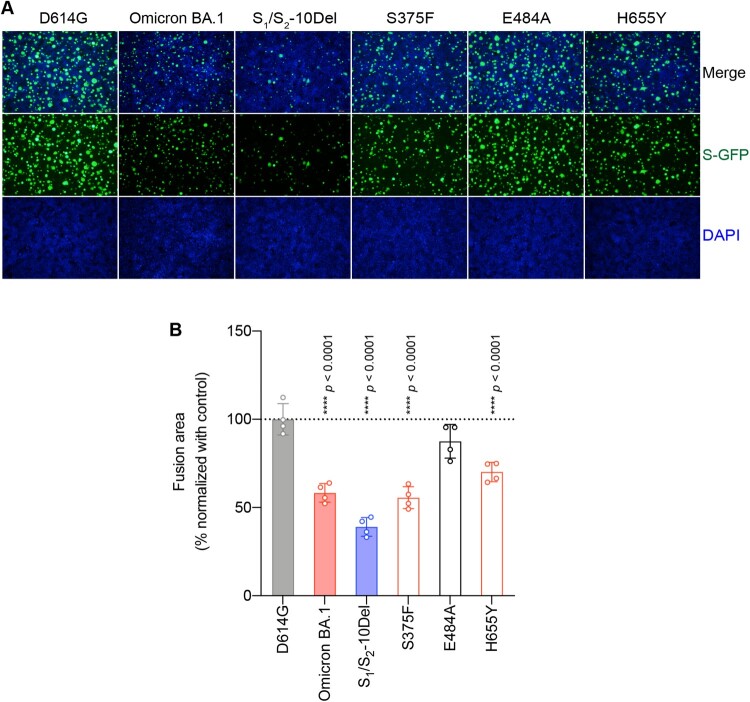
Figure 4.
Determinants for the reduced spike-mediated cell–cell fusion of Omicron BA.1 and BA.2. (A) Representative images of spike-mediated cell–cell fusion. 293T cells (effectors cells) were co-transfected with the indicated spike with GFP1-10, and were co-cultured with 293T cells co-transfected with human ACE2 (hACE2), TMPRSS2, and GFP11 (target cells). The co-cultured cells were fixed with 10% formalin and stained with DAPI. Representative images were from four independent experiments with similar results. (B) The fusion area was normalized with the SARS-CoV-2-D614G spike-mediated cell–cell fusion group by ImageJ. Data represent mean ± SD from the indicated number of biological repeats. Statistical significance was determined with one way-ANOVA. Data were obtained from four independent experiments. Each data point represents one biological repeat. * represented p < 0.05, ** represented p < 0.01, *** represented p < 0.001, and **** represented p < 0.0001. ns, not statistically significant.

