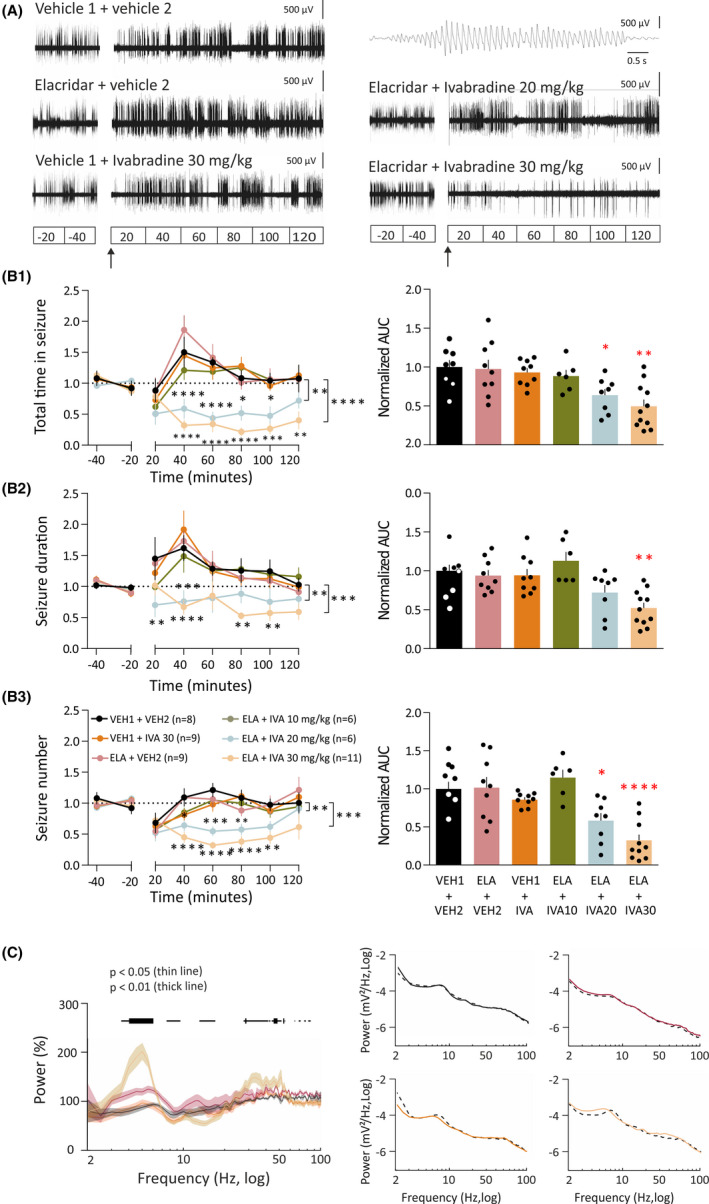
FIGURE 2.

Oral administration of ivabradine (IVA) markedly blocks absence seizures. (A) Representative electroencephalographic (EEG) traces of four different freely moving Genetic Absence Epilepsy Rats From Strasbourg injected with either vehicle (VEH) 1 + VEH2, VEH1 + IVA, elacridar (ELA) + VEH2, ELA + IVA10, ELA + IVA20, or ELA + IVA30. Note the marked reduction in spike‐and‐wave discharges (SWDs) in the ELA + IVA30 group compared to all other groups (a typical SWD is shown enlarged in the top trace on the right). In A and the left plots of B1–3, interruption in the traces is due to the animals being disconnected from the EEG wires for drug administration; ELA (or VEH1) was injected at Time −20 min and IVA (or VEH2) at Time 0 (indicated by the black arrow). Data in B1–3 are normalized to the control period (Section 2). (B1) Time–response curves (left graph) and area under the curve (AUC) of the whole treatment period (right graph) of the total time spent in seizures for VEH1 + VEH2 (black, n = 9), ELA + VEH2 (red, n = 9), VEH1 + IVA (orange, n = 9), ELA + IVA10 (green, n = 6), ELA + IVA20 (blue, n = 8), and ELA + IVA (ocher, n = 11) groups. (B2) Time–response curve (left graph) and AUC (right graph) of the whole treatment period of seizure duration for the six treatment groups (color code and number of animals as in B1). (B3) Time–response curve (left graph) and AUC (right graph) of the whole treatment period of the number of seizures for the six treatment groups (color code and number of animals as in B1). (C) Left graph: Average normalized interictal power spectra of the four treatment groups (number of animals as in B1, except VEH1 + VEH2, n = 6). Horizontal bars on top indicate statistical significance (thin line: p < .05; thick line: p < .01). Right graph: representative examples of interictal power spectra for individual animals of the VEH1 + VEH2 (black), ELA + VEH2 (red), VEH1 + IVA (orange), and ELA + IVA30 (ocher) groups showing both the control period (dashed black line) and the treatment period. *p < .05, **p < .01, ***p < .005, ****p < .001
