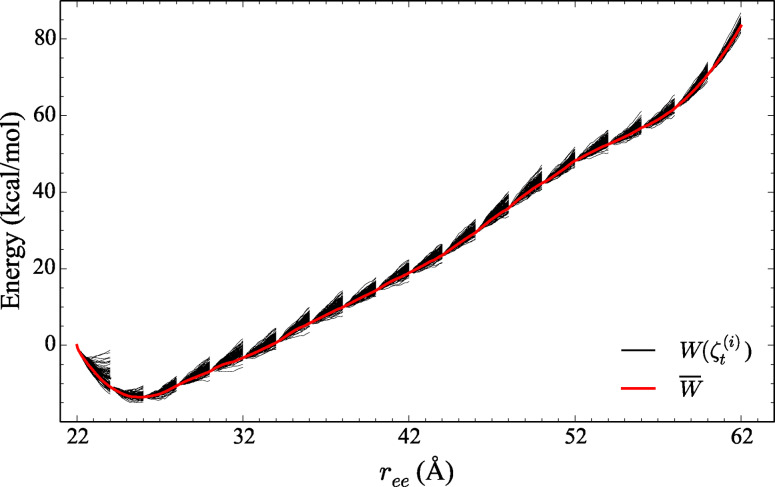
Figure 7.
A typical ASMD simulation is divided into 20 stages, as shown, and sampled from 100 trajectories per stage at a stretching velocity, vs , of 10 Å/ns. for the α‐helical peptide 1PEF. The solid black lines represent the work for each trajectory, W( ), whereas the thick red curve represents the overall PMF, , from Eq. 2.

