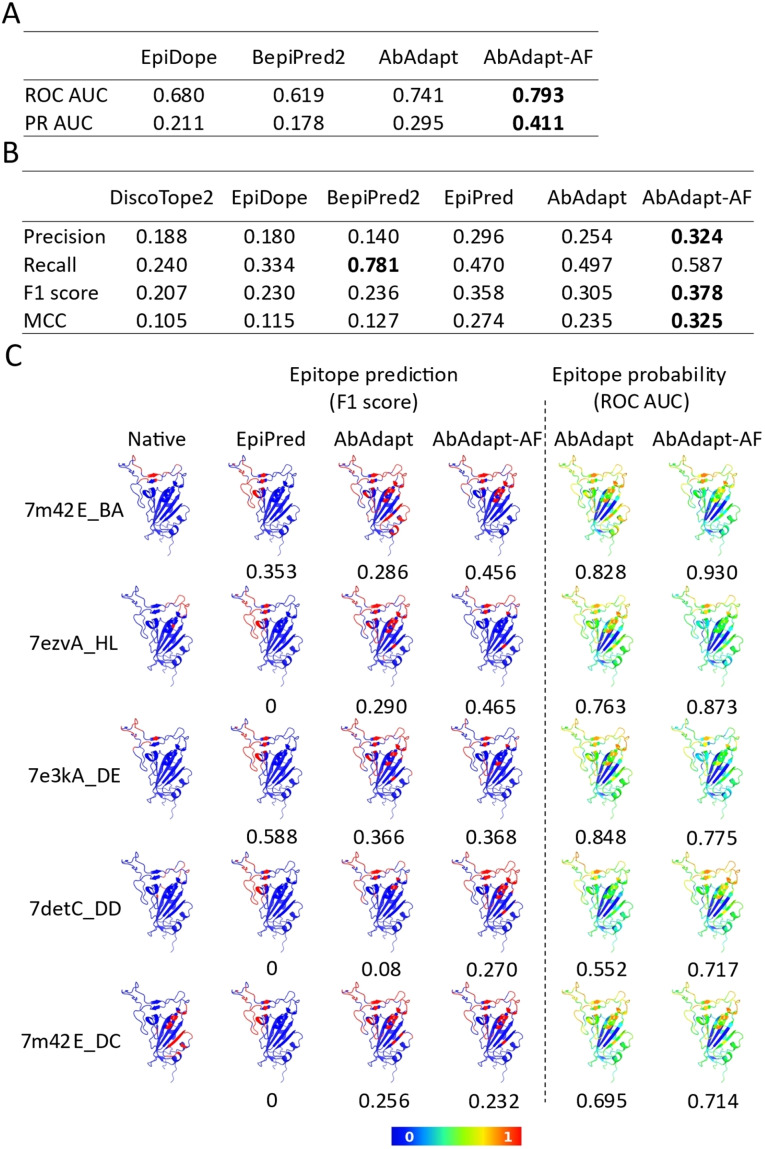
Figure 4.
Epitope prediction of 25 anti‐RBD antibody complexes. The comparison of epitope prediction performance using probability (A) and a threshold for epitope classification (B). The performance indices are calculated in evaluation metrics and averaged. Bold character indicated the highest value of each item. (C) Epitope map visualization of representative queries. The native epitope (column 1) and predicted epitope by EpiPred (column 2), AbAdapt (column 3), and AbAdapt‐AF (column 4) are colored red on the RBD surface. The probability of prediction by AbAdapt and AbAdapt‐AF are shown in columns 5 and 6. The value below each prediction is indicated as F1 score (left) and ROC AUC (right).

