FIGURE 3.

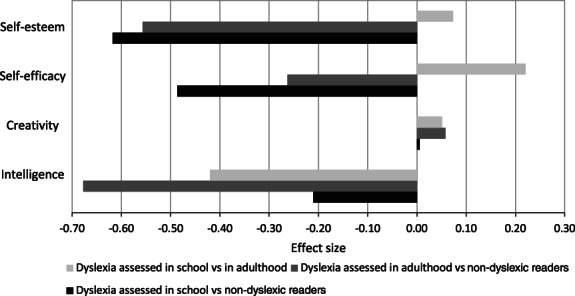
Effect sizes (Z‐scores) showing differences between the two groups of readers with dyslexia and the non‐dyslexic readers on each measure. Z scores were derived from the differences between groups using pooled standard deviations

Effect sizes (Z‐scores) showing differences between the two groups of readers with dyslexia and the non‐dyslexic readers on each measure. Z scores were derived from the differences between groups using pooled standard deviations