
Figure 4.
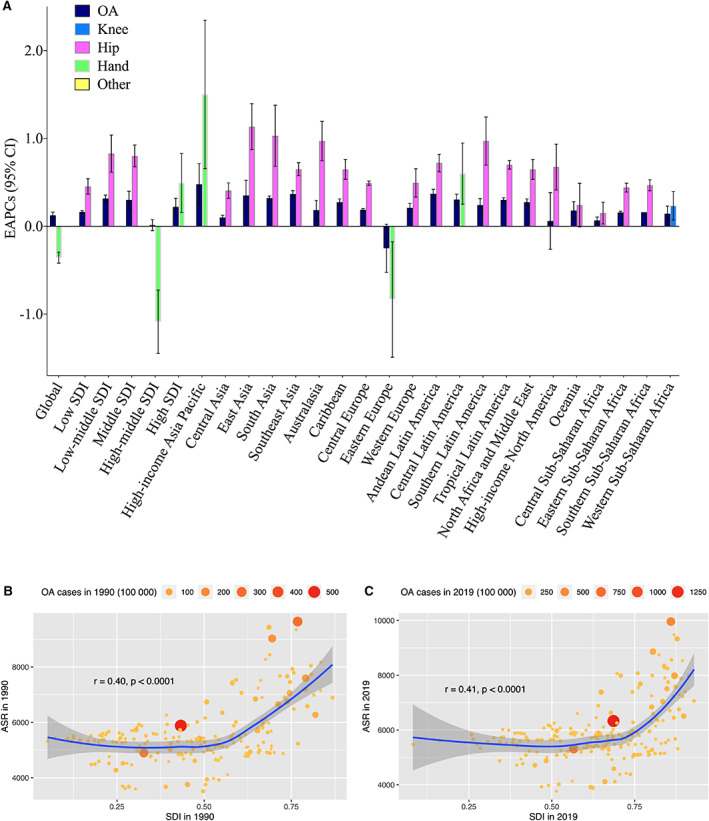
A, Estimated annual percentage change (EAPC) in total osteoarthritis (OA) and according to the affected joint from 1990 to 2019, globally, by Socio‐demographic Index (SDI) category and by geographic region, for both sexes combined. Data for OA overall and for the affected sites with absolute maximum of EAPC are presented for each category. B and C, Correlation between age‐standardized prevalence rate (ASR) of OA and SDI in 1990 (B) and 2019 (C). Circles represent the number of prevalent OA cases in individual countries or territories. 95% CI = 95% confidence interval. Color figure can be viewed in the online issue, which is available at http://onlinelibrary.wiley.com/doi/10.1002/art.42089/abstract.