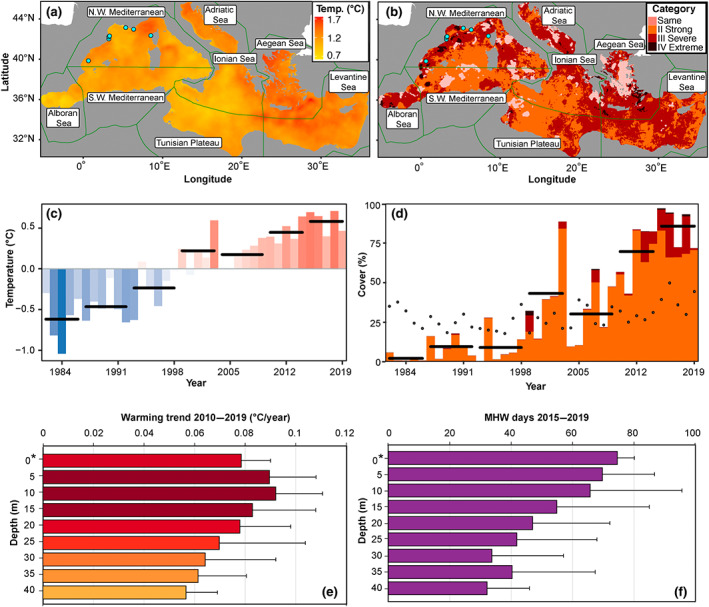
FIGURE 1.

Patterns of warming and marine heatwaves (MHWs) across the Mediterranean Sea. (a) The difference in temperature between the mean of 2015 to 2019 minus the mean of 1982 to 1986. Green lines and blue dots have been added to visualize, respectively, the Mediterranean ecoregions and the monitoring areas with in‐situ (along depth) temperature monitoring (also in panel b). (b) The highest category of MHW experienced from 2015 to 2019 at locations where only a category I MHW was experienced in 1982 to 1986. Light pink areas show when a category II or greater MHW occurred in the earlier period. (c) Annual sea surface temperature (SST) anomalies from 1982 to 2019 (climatology period is 1982 to 2019). Horizontal black bars show 5‐year averages over the time series. (d) The annual surface area (%) of the Mediterranean affected by category II or greater MHWs from 1982 to 2019. The color of the bar shows what proportion relates to the MHWs category. Horizontal black bars show roughly 5‐year averages in % of surface affected by category II or greater MHWs; finally the black dots show the average global ocean cover (%) per year for category II or greater MHWs. Category I moderate events are excluded here to allow for a better understanding of the increasing severity of MHWs. (e) The average per depth strata decadal warming trend for 7 nearshore sampling areas from the Northwestern Mediterranean sea. Error bars indicate the standard deviation. The asterisk (*) indicate that satellite data were used for the surface whereas subsurface data originate from in situ monitoring every 5 m from 5 to 40 m depth. (f) The average along depth number of MHW days for the months from June to November over the study period (2015–2019) for the seven Northwestern Mediterranean sampling areas. Error bars indicate the standard error. The asterisk (*) indicate that satellite data were used for the surface, whereas subsurface data originate from in situ monitoring every 5 m from 5 to 40 m depth. The map lines in panels (a) and (b) delineate study areas and do not necessarily depict accepted national boundaries.
