FIGURE 2.

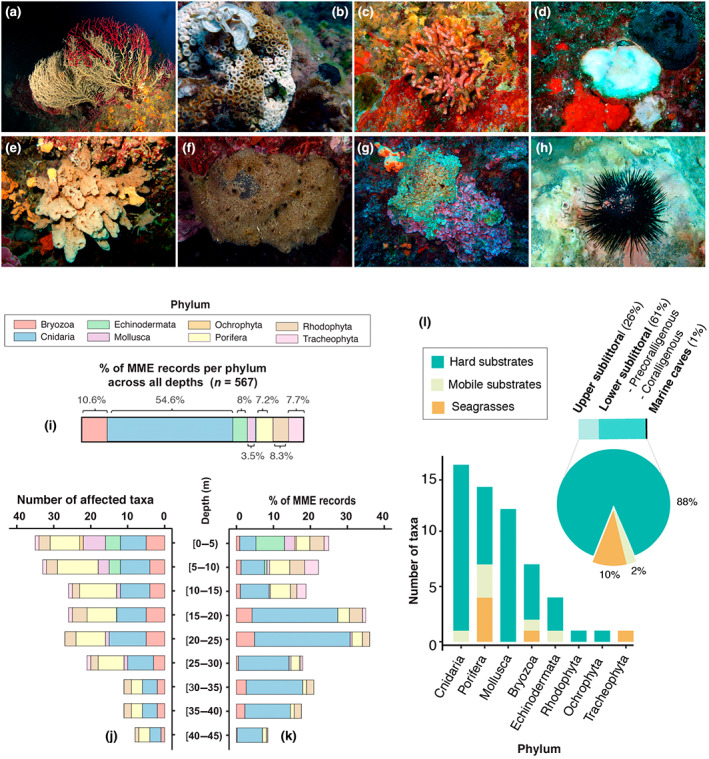
Ecological impacts of the 2015–2019 mass mortality events (MMEs). (a) A red gorgonian Paramuricea clavata colony exhibiting partial mortality (brown areas overgrown by epibionts) contrasting with live tissue (red areas; 35 m depth in Tavolara Island, Sardinia, Italy; photo by: M. Munaretto). (b) A colony of the reef‐building coral Cladocora caespitosa with signs of partial mortality (bare skeleton in white areas) contrasting with live tissue (brown areas; 3–4 m depth in Tabarca Island, Alicante, Spain; photo by A. Izquierdo). (c) A colony of the bryozoan Myriapora truncata showing mortality (white parts overgrown by epibionts; 15 m depth in Ibiza, Balearic Islands, Spain; photo by J. Garrabou), (d) An individual of the mollusk Spondylus gaederopus affected by mortality (white; 25 m depth in Ullastres, Catalan coast; photo by P. López‐Sendino). (e) The massive sponge Agelas oroides exhibiting mortality (brown spongin network free of cellular material) contrasting with the alive orange tissue (16 m depth, Chalkidiki peninsula, North Greece; photo by V. Gerovasileiou). (f) Almost completely dead individual of Spongia officinalis showing brown spongin network free of cellular material (10 m depth in Portofino, Liguria, Italy; photo by F. Betti). (g) Partially dead rhodophyte Mesophyllum sp. (10 m depth, Kalymnos Island, South Greece; photo by M. Sini). (h) Arbacia lixula exhibiting mortality with the loss of spines (3 m depth in Cap de Creus, NE Spain; photo by J. Garrabou). (i) Percentage (%) of MME records per phylum across the entire data set. (j) Number of taxa affected per phylum over depth. (k) Percentage (%) of MME records per phylum over depth. (l) Number of affected taxa per phylum and habitat category (barplot), and percentage (%) of affected habitat category across the overall mortality data set (pie chart).
