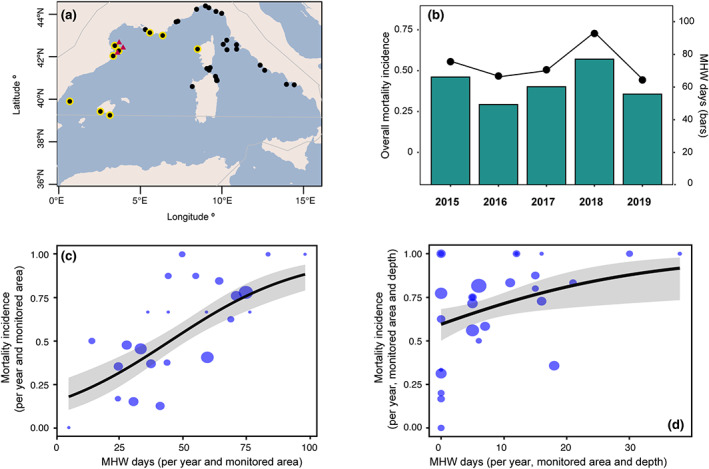
FIGURE 4.

Relationship between heat exposure (marine heatwave [MHW] days) and mortality incidence in the Northwestern Mediterranean ecoregion during 2015–2019. (a) Map of the Northwestern Mediterranean ecoregion showing the location of the monitored areas included in the analysis; black dots indicate all monitored areas in the Northwestern Mediterranean Sea (used in the regional analysis shown in panel b), yellow dots indicate only the monitoring areas considered for the analysis shown in panel c and red triangles indicate the areas with long‐term, in situ temperature monitoring used for the in‐depth analysis shown in panel d (see Section 2.3 for further details). (b) Bars and points show, respectively, the yearly mean number of MHW days and mortality incidence (proportion of records showing mortality) observed across the Northwestern Mediterranean basin. Panels c and d show respectively the relationship between heat exposure (yearly average of MHW days during the JJASON period) at the surface (sea surface temperature) or across depth (from 5 to 40 m) and the corresponding mortality incidence in the studied monitored areas, years, and/or depths. The lines show the predicted values of the generalized linear models and their confidence interval (95%). The size of the points is proportional to the sampling size (number of populations for all the species surveyed in each monitored area, year and/or depth; minimum number = 3, maximum number = 50). The map lines in panel (a) delineate study areas and do not necessarily depict accepted national boundaries.
