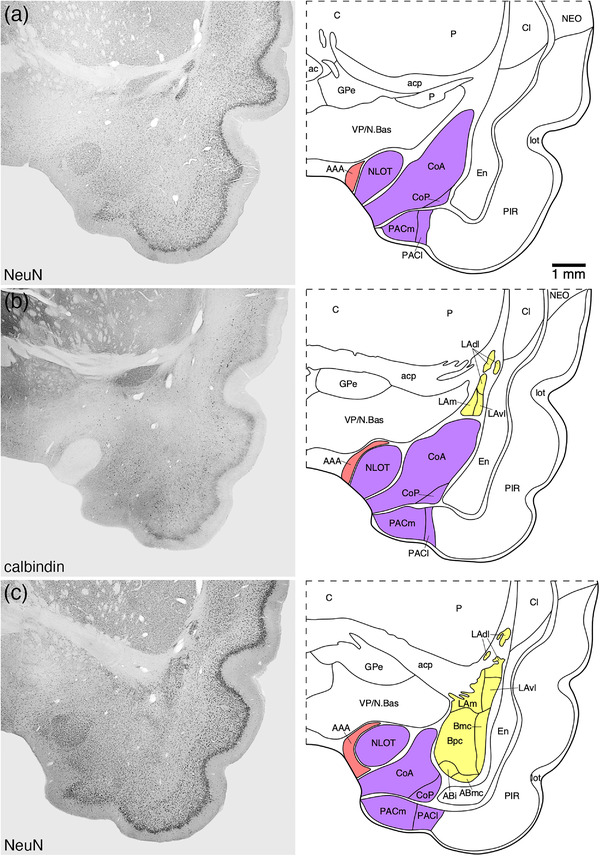
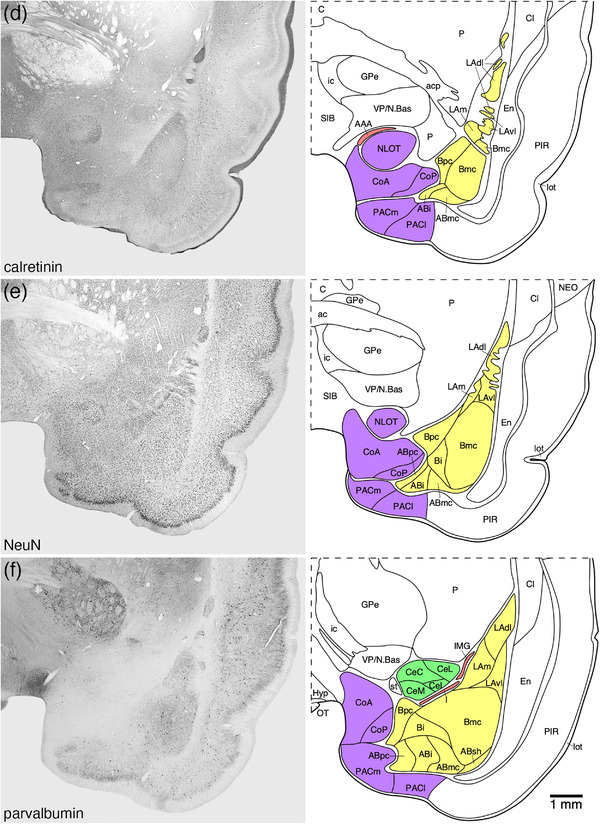
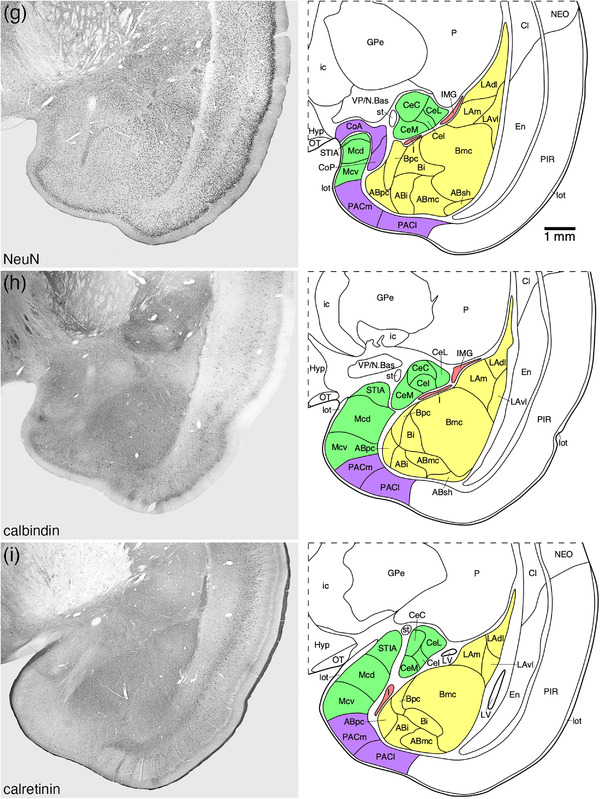
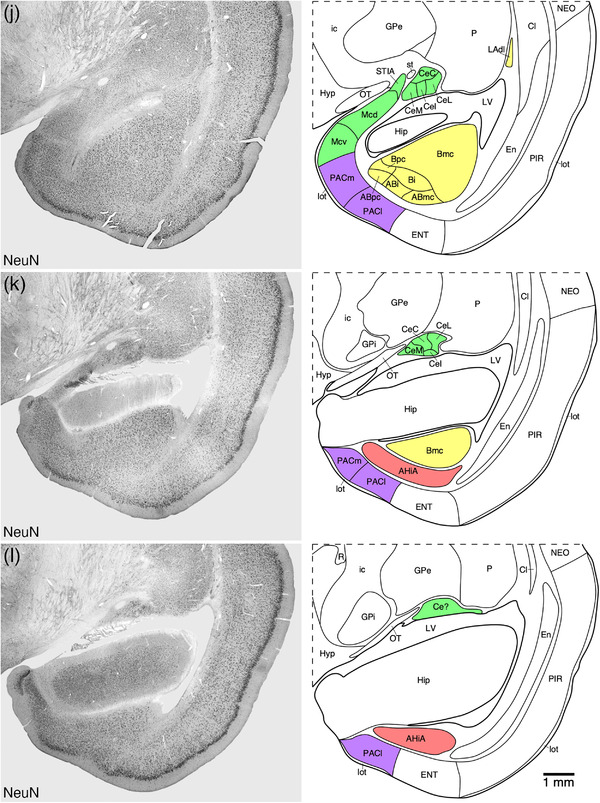
FIGURE 2.
Representative photomicrographs and associated diagrammatic reconstructions showing the nuclear and cortical organization of the amygdaloid body of the tree pangolin. The photomicrographs are of coronal sections immunostained for neuronal nuclear marker (NeuN, a, c, e, g, j, k, l), parvalbumin (f), calbindin (b, h), and calretinin (d, i). The associated diagrams are from the same series of sections from which the photomicrographs were taken, but represent the combined architectural analysis from all sections, as compared to the single representation shown in the photomicrographs. In all photomicrographs and diagrams, dorsal is to the top and medial to the left. Photomicrograph and diagram (a) represent the most rostral portion of the amygdaloid body, while photomicrograph and diagram (l) represent the most caudal portion. Each photomicrograph and diagram are approximately 250 μm apart. The various nuclear/cortical groups of the amygdaloid body are represented with differing colors, including the deep or basolateral group in yellow, the superficial or cortical‐like or corticomedial group in purple, the centromedial group in green, and the remaining amygdaloid nuclei in red. See list for abbreviations


