
FIGURE 1.
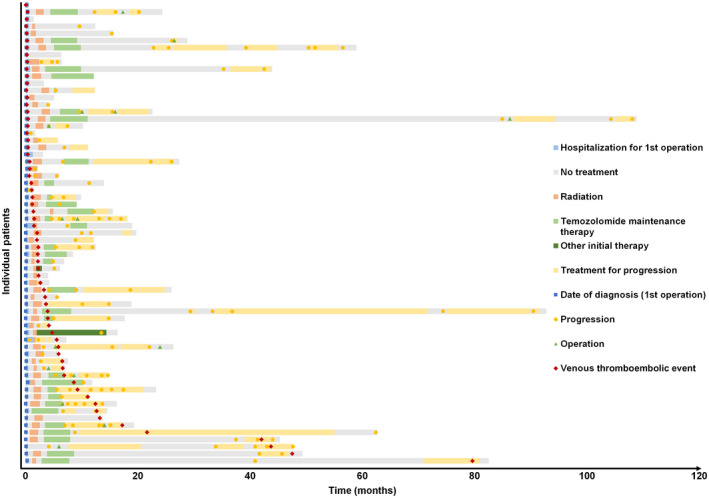
Swimmer plot depicting the occurrence of venous thromboembolic events for each patient. Each bar of the y‐axis represents one individual patient of the venous thromboembolic events (VTEs) cohort (n = 65). The x‐axis represents time in months since hospitalization for initial surgery. Red diamonds represent the VTEs. Blue squares represent the date of first operation. Yellow dots represent dates of tumor progression. Green triangles represent any further operation other than the initial surgery. Bars represent the duration of hospitalization for the first operation (blue), treatment‐free periods (gray), duration of initial radiotherapy plus/minus concomitant temozolomide (orange), duration of maintenance temozolomide (bright green), duration of initial therapy other than temozolomide (dark green), and duration of any other treatment at time of progression (yellow)