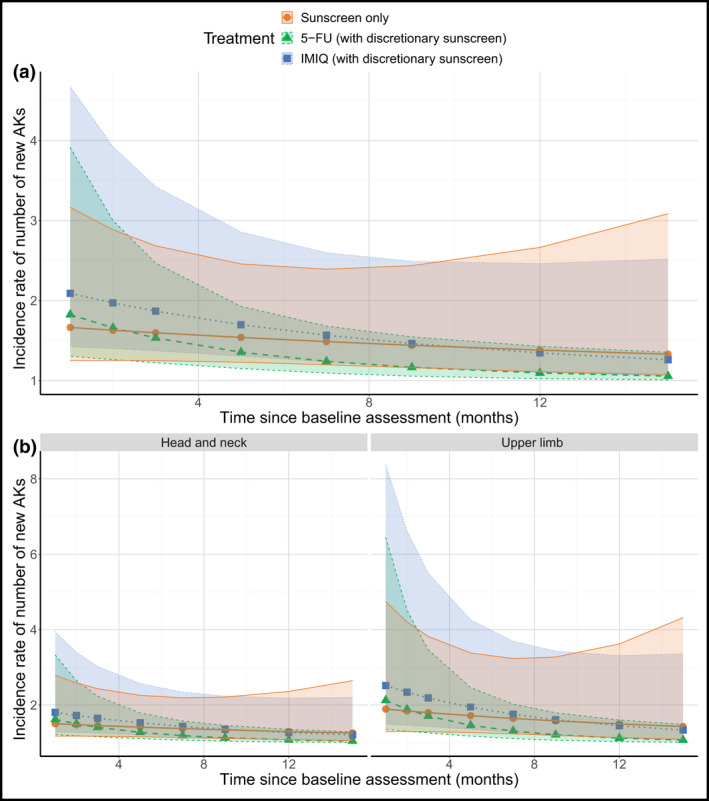
Figure 5.

Fixed effects from new AKs in the treatment zone model. Points indicate the mean estimate with 95% confidence intervals indicated by the shaded region, shaded according to treatment, in the pooled population (a) and by stratification variables (b). Note: this figure shows the output for the model described in Appendix S3 and considers all randomized patients for assessment of new AKs. It shows a smoothed function of how the incidence rate of new AKs changes with time rather than the observed data. AK, actinic keratosis; 5‐FU, 5% 5‐fluorouracil; IMIQ, 5% imiquimod. [Colour figure can be viewed at wileyonlinelibrary.com]
