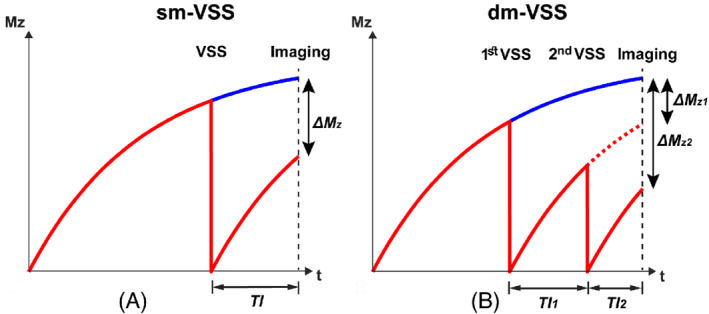
FIGURE 5.

Schematics showing the arterial longitudinal magnetization (Mz) of single‐module velocity selective saturation (sm‐VSS) (A), and dual‐module VSS (dm‐VSS) labeling (B) under the label (red) and the control (blue) conditions. In dm‐VSS, the dashed red curve represents the magnetization of arterial spins that are labeled by only the first VSS module (∆M Z1); the solid red curve represents those labeled by both VSS modules (∆M Z2). TI1 and TI2 are the inflow times between the 2 VSS modules and imaging, respectively
