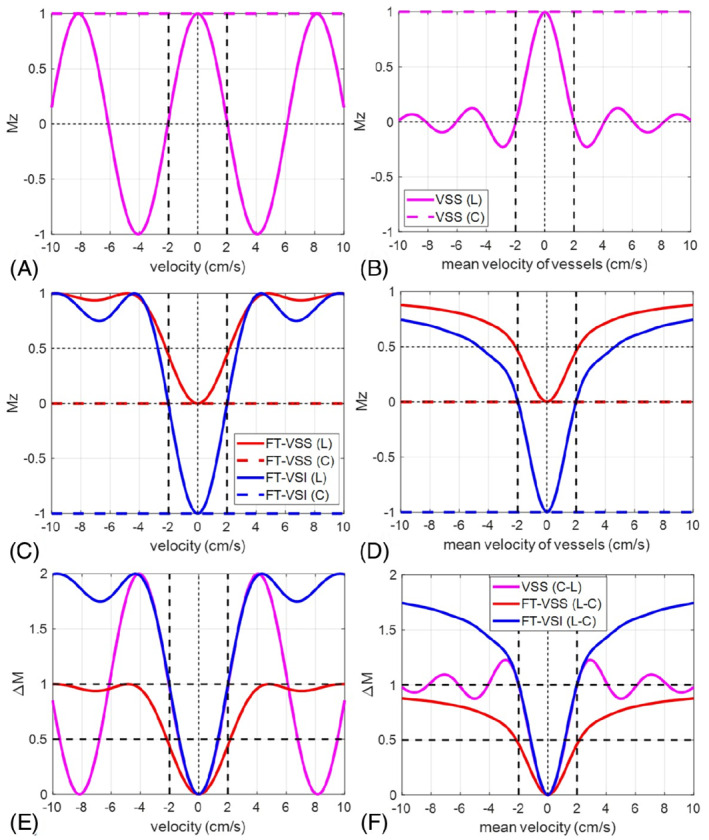
FIGURE 6.

Simulated M z ‐velocity responses of (A) velocity selective saturation (VSS) (magenta), (C) Fourier transform (FT)‐VSS (red) and FT‐velocity selective inversion (VSI) (blue), and (B, D) the corresponding results after the laminar flow integration (note that the x‐axis is the mean velocity). The horizontal dashed lines are their magnetization responses under the control, respectively. Their arterial spin labeling (ASL) subtractions (ΔM) between label (L) and control (C) are displayed before (E) and after (F) laminar flow integration as well. Vcut is defined as the first crossing of ΔM = 1, as indicated by the vertical black dotted lines at 2.0 cm/s (E,F). For VSS, the Vcut is chosen under the assumption of laminar flow (F). This point is the first 0‐crossing of the velocity response under the label condition (B). For FT‐VSI, Vcut can be defined without using laminar flow model (E). This is also the 0‐crossing or half‐width‐half‐maximum point of FT‐VSI's velocity response under the label condition (C)
