
FIGURE 3.
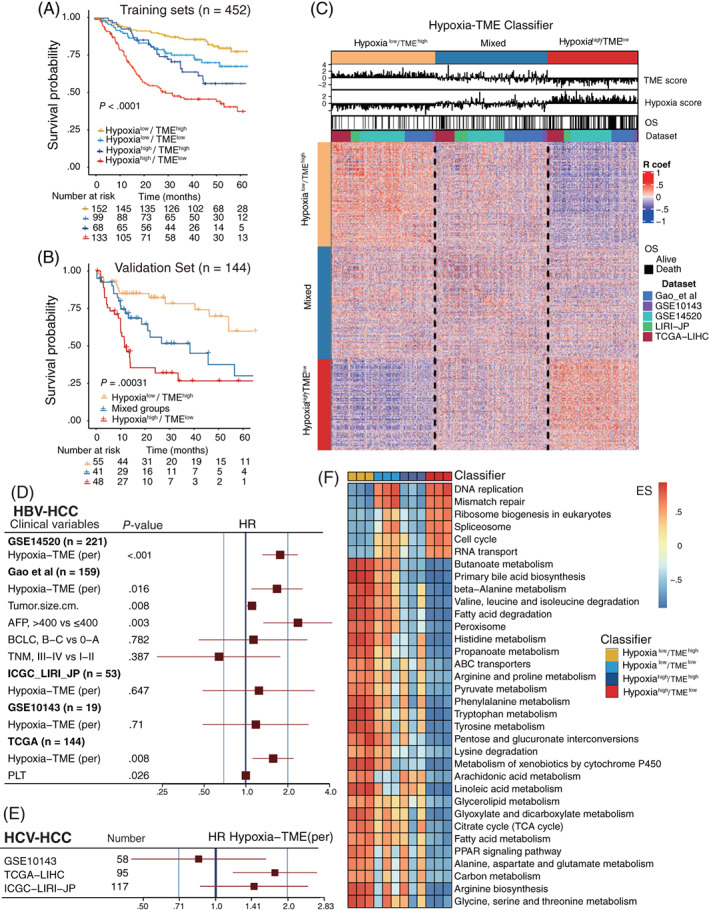
Prognostic value and tumor cellular signaling pathways analysis based on Hypoxia‐TME classifier. (A) Kaplan‐Meier overall survival curves of four HBV‐HCC training cohorts (n = 452) stratified into four different subgroups based on the Hypoxia‐TME classifier (Hypoxialow/TMEhigh, Hypoxialow/TMElow, Hypoxiahigh/TMEhigh and Hypoxiahigh/TMElow). Log‐rank test, P < .001. (B) Kaplan‐Meier overall survival curves of the independent validation HBV‐HCC cohort (n = 144) stratified into three different subgroups based upon the Hypoxia‐TME classifier (Hypoxialow/TMEhigh, mixed and Hypoxiahigh/TMElow). Log‐rank test, P < .001. (C) Heat map showing the correlations matrix among all Hypoxia‐TME signatures in three different subgroups based upon Hypoxia‐TME classifier. Positive (red) and negative (purple) correlations are indicated. (D) Multivariate cox analysis of the Hypoxia‐TME classifier in five HBV‐HCC cohorts. (E) Cox analysis of the Hypoxia‐TME classifier in three HCV‐HCC cohorts. (F) Compare tumor proliferative signaling pathways and tumor metabolism‐related pathways among four Hypoxia‐TME subgroups based on mRNA expression levels (GSE14520, Gao et al, TCGA cohorts): higher enrichment scores (red), lower enrichment scores (blue) [Color figure can be viewed at wileyonlinelibrary.com]