
FIGURE 4.
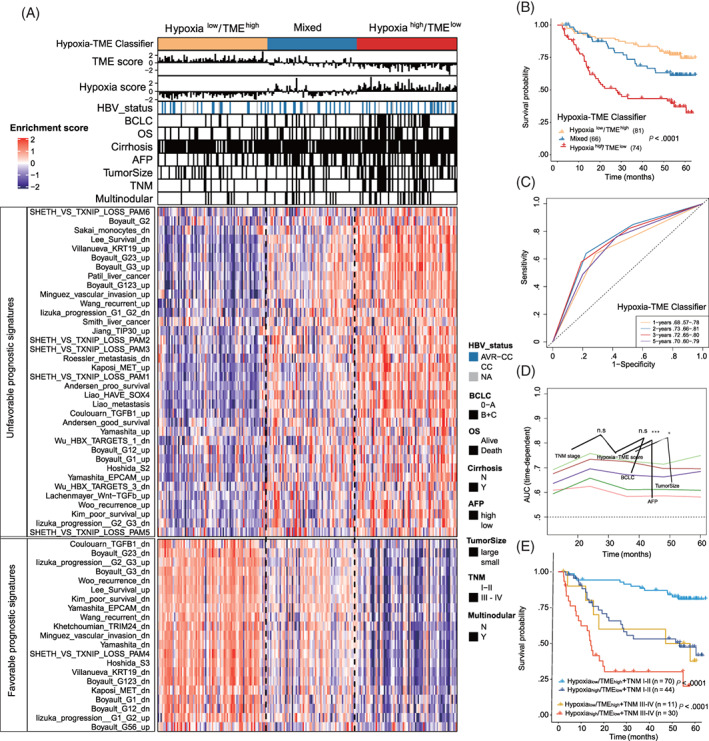
Association between Hypoxia‐TME classifier and other HCC‐related molecular signatures. (A) The association between Hypoxia‐TME classifier and clinical characteristics/other HCC‐related molecular signatures. AVR‐CC, active viral replication chronic carrier; CC, chronic carrier; AFP (high) means >400 ng/mL; AFP (low) means <400 ng/mL; tumor size (large) >5 cm, tumor size (small) <5 cm. Higher enrichment scores (red), lower enrichment scores (purple) (GSE14520). (B) Kaplan‐Meier overall survival curves of an HBV‐HCC cohort stratified into three different subgroups based on the Hypoxia‐TME classifier. Log‐rank test, P < .001. (C) ROC curves for the 1‐, 2‐, 3‐, 5‐year survival according to the Hypoxia‐TME classifier. (D) Comparisons of Hypoxia‐TME classifier with other clinical prognostic staging systems/biomarkers under the time‐dependent ROC for the incidence of overall survival. TNM staging system (light green), Hypoxia‐TME classifier (brown), BCLC staging system (purple), tumor size (dark green), AFP (brick‐red). (E) Kaplan‐Meier overall survival curves of HBV‐HCC patients, divided by the combination of Hypoxia‐TME classifier and TNM staging system. Log‐rank test, P < .001 [Color figure can be viewed at wileyonlinelibrary.com]