Figure 3.

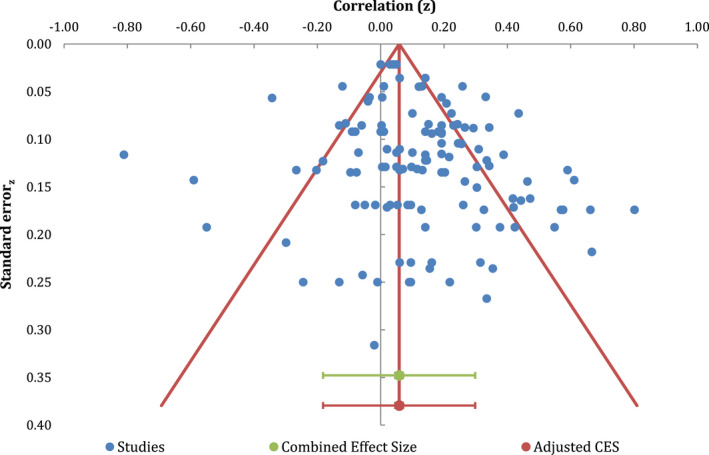
The funnel plot shows the overall mean effect size of eligible studies converted to Fisher’s z on the X‐axis and standard errors on the Y‐axis, along with the expected distribution of studies in the absence of bias.

The funnel plot shows the overall mean effect size of eligible studies converted to Fisher’s z on the X‐axis and standard errors on the Y‐axis, along with the expected distribution of studies in the absence of bias.