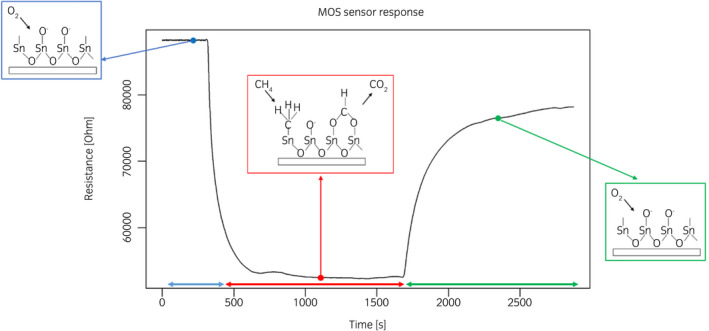
Fig. 3.

Typical response of MOS sensor of the eNose array recorded during the analysis of urine headspaces, comprising three phases: before (i.e., sensors are exposed to odorless air), during (i.e., sensors are exposed to urine headspace) and after (i.e., sensors are exposed again to odorless air). [Colour figure can be viewed at wileyonlinelibrary.com]
