Fig. 6.

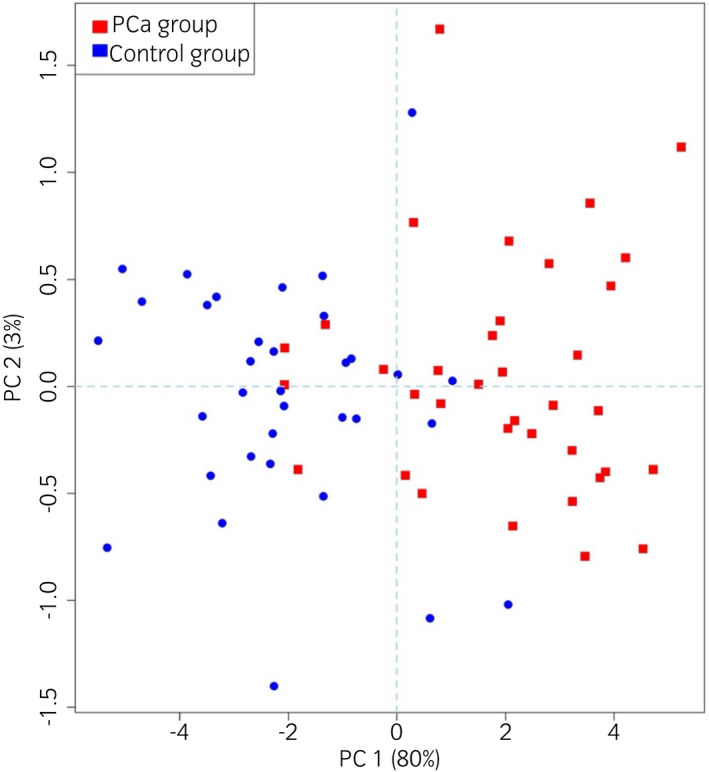
Score plot, obtained by means of Principal Component Analysis, illustrating the eNose capability to distinguish PCa patients (red points) from control participants (blue points). [Colour figure can be viewed at wileyonlinelibrary.com]

Score plot, obtained by means of Principal Component Analysis, illustrating the eNose capability to distinguish PCa patients (red points) from control participants (blue points). [Colour figure can be viewed at wileyonlinelibrary.com]