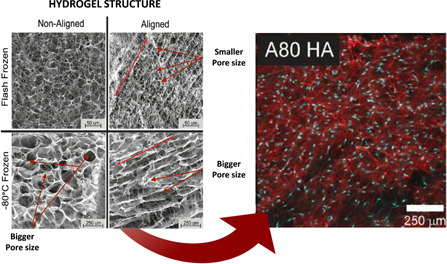
Figure 5.

Pore size effects. Larger pores indicate higher proliferation levels and fibronectin expression. Left: SEM images of scaffolds frozen in non‐aligned and aligned configurations. Red lines indicate the direction of the pore alignment. Scale bar: 50 μm for the flash frozen and 250 μm for the −80°C frozen scaffolds. Right: Confocal micrographs of hyaluronic acid scaffolds after 2 weeks of culture. Fibronectin (red) and nuclei (blue). Reproduced with permission from M. J. Osmond et al. (2020); John Wiley and Sons.
