
FIGURE 1.
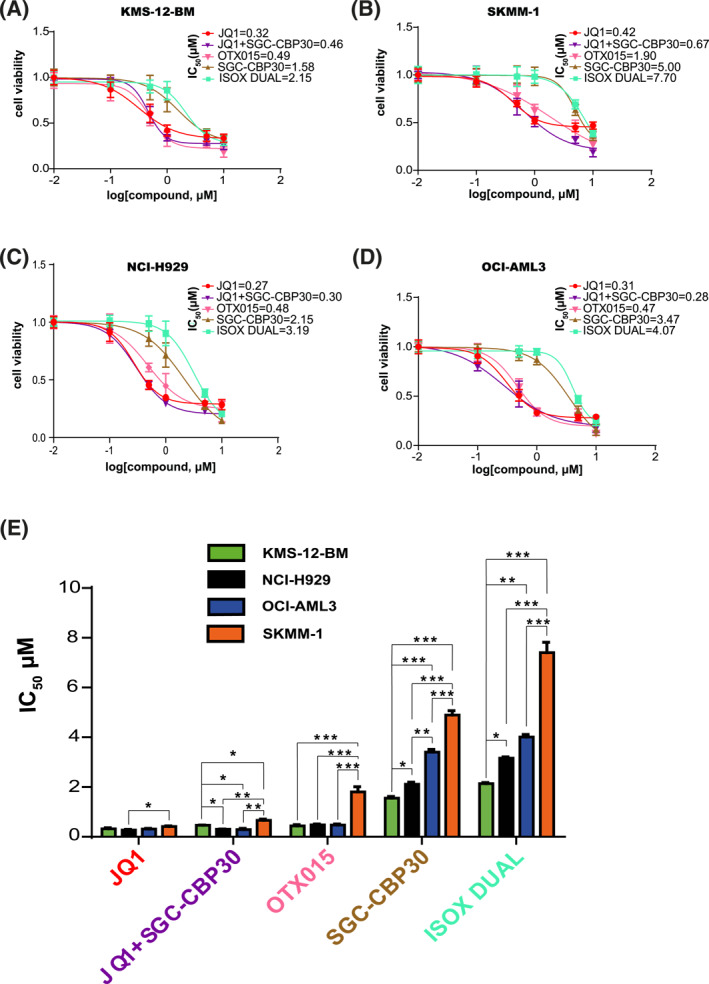
Characterization of the effect of JQ1, OTX015, SGC‐CBP30, ISOX‐DUAL and JQ1+ SGC‐CBP30 treatments on MM cell‐lines viability. Reduction of KMS‐12‐BM (A), NCI‐H929 (B), SKMM‐1 (C) and OCI‐AML3 (D) cell viability after treatment with different concentrations of bromodomain inhibitors for 48 h. Cell survival is plotted against the logarithm of inhibitor concentrations. JQ1 (red curves), JQ1+SGC‐CBPEP30 (purple curves), OTX015 (pink curves), SGC‐CBP30 (brown curves) and ISOX‐DUAL (light blue curves). Results are represented as mean ± Standard Error of Mean (SEM) of triplicate assays. (E) The graph shows the IC50 values of JQ1, JQ1+SGC‐CBP30, OTX015, SGC‐CBP/EP30, ISOX‐DUAL after 48 h treatment of KMS‐12‐BM (green bars), NCI‐H929 (black bars), OCI‐AML3 (blue bars) and SKMM‐1 (orange bars) cells