
FIGURE 2.
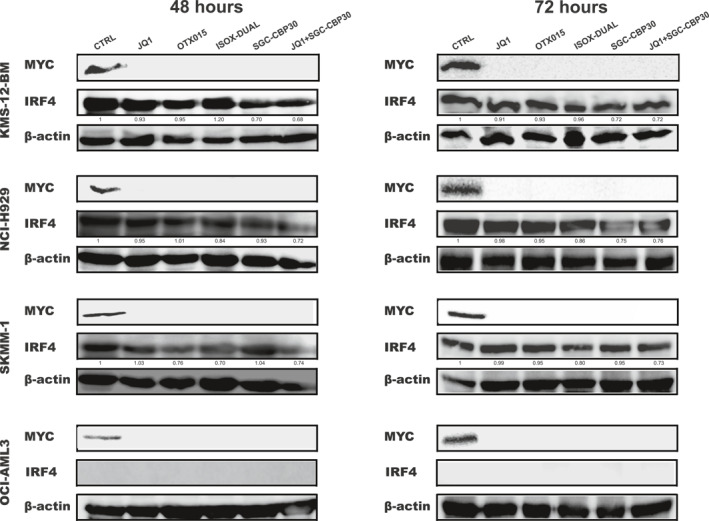
IRF4 and MYC protein levels in MM cell‐lines following treatment with JQ1, OTX015, SGC‐CBP30, ISOX‐DUAL and JQ1+ SGC‐CBP30. Changes in MYC and IRF4 protein levels were analyzed by Western Blot following IC50 drug treatments for 48 and 72 h in KMS‐12‐BM, SKMM‐1, NCI‐H929 and OCI‐AML3. The control (CTRL) is 2 mM DMSO treatment. β‐actin was used as loading control. Quantification was performed by using LI‐COR machine and protein levels were expressed relative to the control treatment