
FIGURE 6.
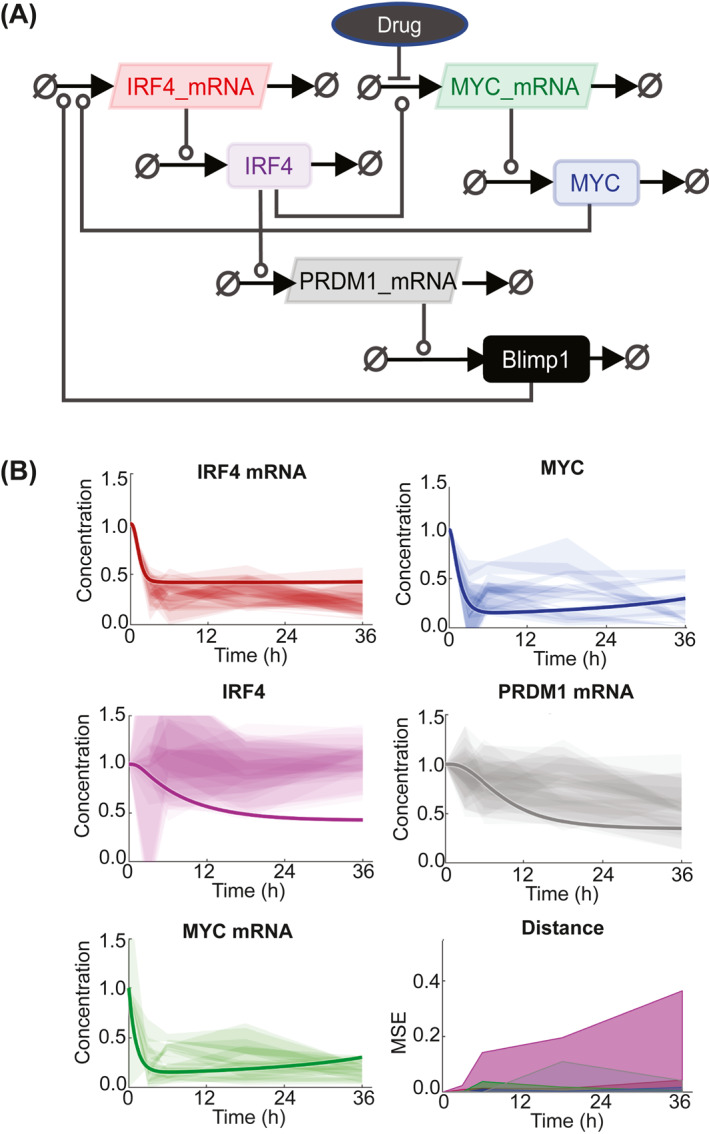
Computational model of the molecular regulatory network in MM cells. A, Systems Biology Graphical Notation (SBGBN) diagram of the model of IRF4, MYC and PRDM1 regulation. Positive regulation is indicated by lines capped with circles. Negative regulation is indicated by lines capped with bars. B, Experimentally measured expression of the indicated molecular species in H929, SKMM‐1, KMS cell‐lines exposed to SGC‐CBP30, JQ1, OTX015, ISOX‐DUAL, and JQ1+SGC‐CBP30 combination. Each shaded region represents the standard deviation of 3 experimental replicates. The modeled response is shown with a solid line. The model assumes a half‐life for IRF4 of 7 h. The squared distance between the mean experimental result and modeled response for each timepoint is shown in the bottom right with colors consistent with other panels