
FIGURE 5.
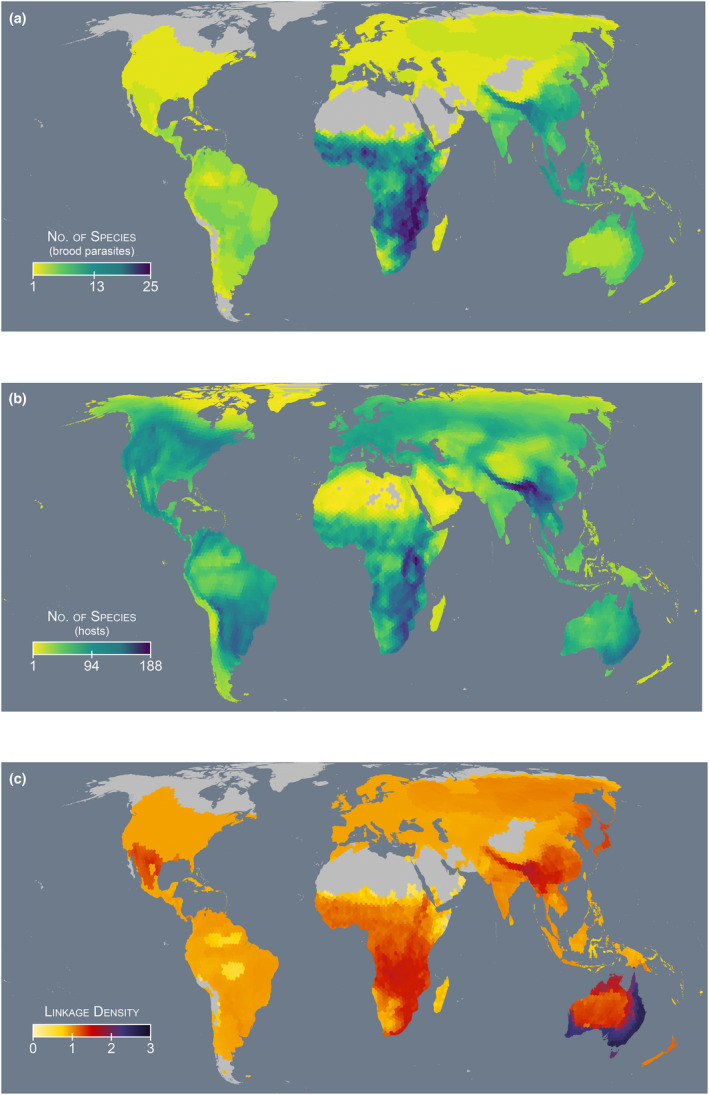
Heatmaps describing (a) global patterns of brood parasite species diversity; (b) host species diversity; and (c) brood parasite–host system complexity. System complexity is measured as the linkage density of potential brood parasite–host systems for each respective land hexagon. Grey land areas represent regions where either no species of brood parasites (a and c) or hosts (b) occur