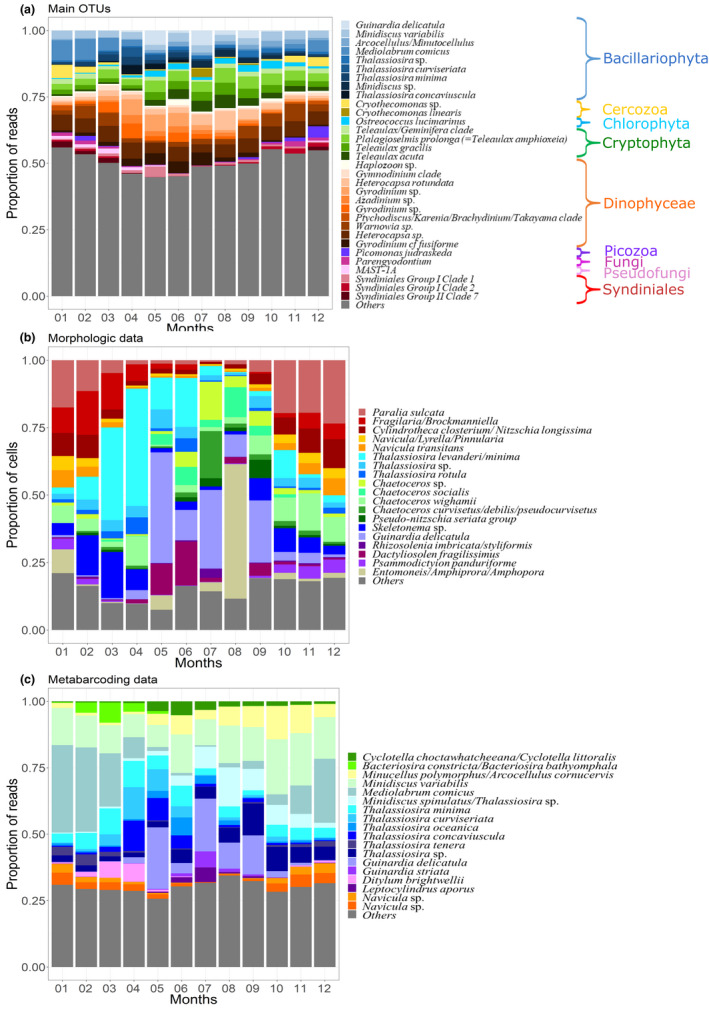
FIGURE 5.

Typical seasonal variations of the dominant OTUs and overall contribution of the major diatoms species to the protist assemblage at the SOMLIT‐Astan sampling station over the period 2009–2016. The histograms show the contributions (a) to total DNA reads abundance of the 32 dominating OTUs (accounting for 51.5% of all reads), (b) of the main diatoms to total diatoms abundances (microscopy count of plankton >10 μm) and (c) of the main diatoms to total diatom reads abundances. All microscopy counts and OTUs were assigned at the highest taxonomic level. Species selected were the 10 most abundant (5 for diatoms) for at least one month, taking into account mean monthly abundances
