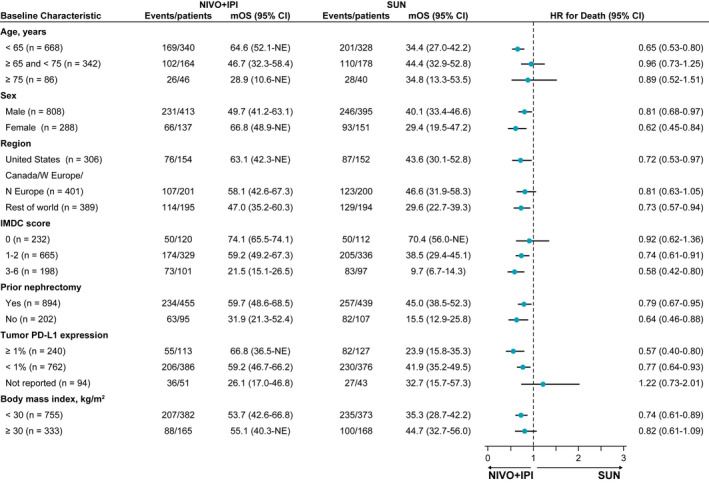
Figure 4.

Subgroup analysis of overall survival is illustrated in intent‐to‐treat patients. Note that hazard ratios (HRs) were not computed for subset categories that included <21 patients per treatment group. CI indicates confidence interval; IMDC, International Metastatic Renal Cell Carcinoma Database Consortium; mOS, median overall survival; N Europe, northern Europe; NE, not estimable; NIVO+IPI, nivolumab plus ipilimumab; PD‐L1, programmed death ligand 1; SUN, sunitinib; W Europe, western Europe.
