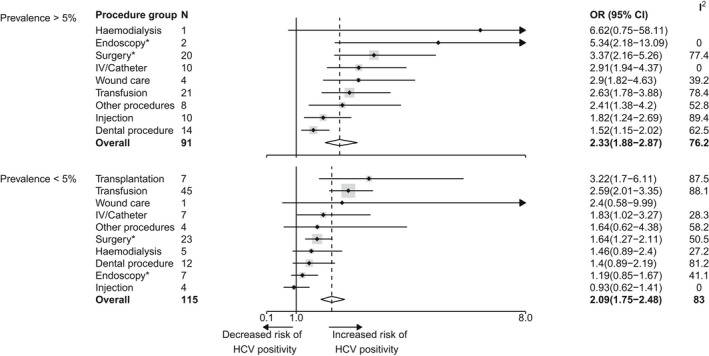
FIGURE 5.

Forest plot reporting pooled OR estimates for HCV infection risk associated with different groups of iatrogenic procedures for high HCV prevalence countries (>5%) versus low HCV prevalence countries (<5%). The high prevalence group includes Egypt, Pakistan and Mali. Points correspond to average estimates and error bars correspond to 95% CI of these estimates. The solid line represents the limit for which OR = 1 and the dotted line the average value of the overall estimate. The total number of observations used for each pooled OR calculation is specified in the column N and the heterogeneity for each estimation is depicted in the column I 2. A given study could be used in the OR estimation of multiple procedures groups. Procedures are sorted based on the value of their associated mean estimate, from the highest to the lowest. There was no measure reported for transplantation in high HCV prevalence countries. *: procedures for which a significant different was found between high and low prevalence countries; Blanks within the I 2 column correspond to the absence of heterogeneity because of procedure group counting only one observation. Overall difference between high and low prevalence countries: p‐value = 0.33. CI, confidence interval; HCV, hepatitis C virus; OR, odds ratio.
