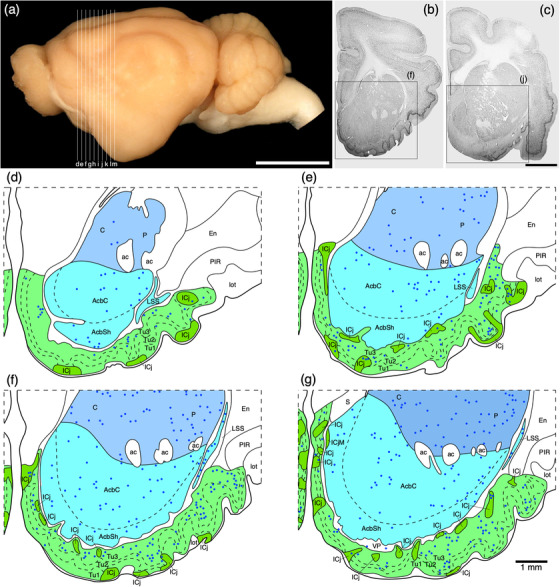
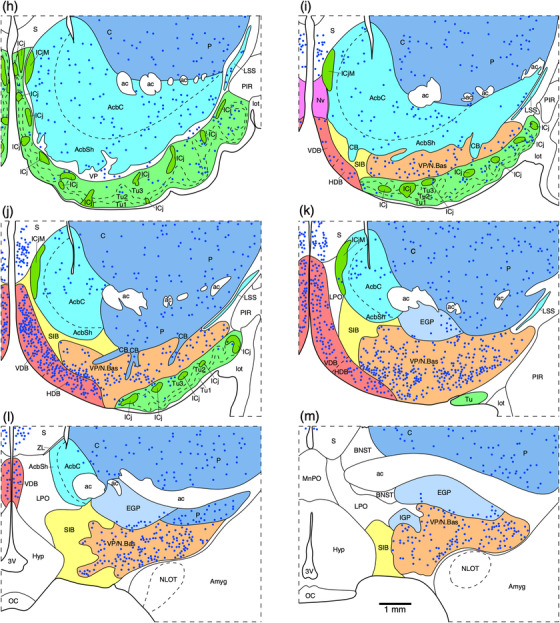
FIGURE 3.
(a) Photograph of the lateral aspect of the brain of the tree pangolin showing the levels at which the coronal sections imaged (b and c) and reconstructed (d–m) were taken. Scale bar in (a) = 1 cm and applies to (a) only. (b and c) Photomicrographs of coronal sections through the tree pangolin telencephalon, taken at the levels corresponding to (f) and (j) in (a), showing examples of the regions that were magnified and reconstructed (boxed regions), in these two cases figurines (f) and (j) specifically. Scale bar in (c) = 3 mm and applies to (b) and (c). (d–m) Diagrammatic reconstructions showing the nuclear organization of the cholinergic basal forebrain and ventral striatopallidal complex of the tree pangolin. In all figurines, dorsal is to the top and medial to the left. Figurine (d) represents the most rostral section in which these structures were observed, while figurine (m) represents the most caudal section. Each figurine is approximately 500 μm apart. The various nuclei/nuclear groups are represented with differing colors. Choline acetyltransferase immunopositive neurons are represented with blue dots, each dot representing a single neuron. See list for abbreviations


