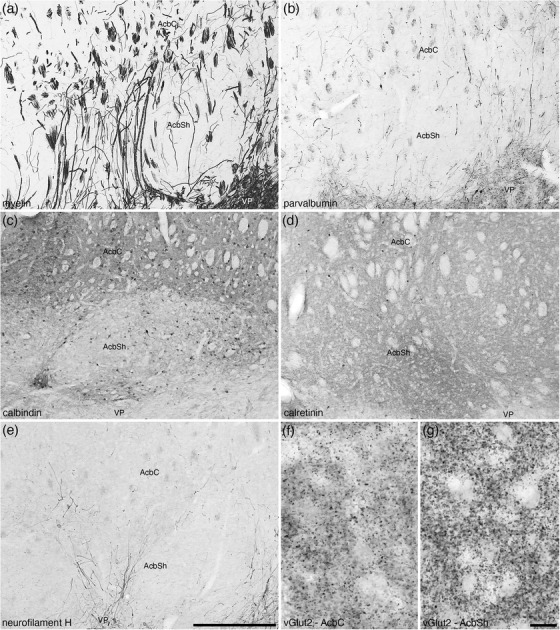
FIGURE 18.

Photomicrographs of coronal sections from the brain of the tree pangolin detailing the subtle myeloarchitectural (a) and chemoarchitectural (b–g) differences between the core (AcbC) and shell (AcbSh) regions of the nucleus accumbens. The sections depicted here were stained for myelin (a), parvalbumin (b), calbindin (c), calretinin (d), neurofilament H (e), and vesicular glutamate transporter 2 (vGlut2; f and g). While the border between the AcbC and AcbSh is best considered to be a gradient of variation, we could observe substantive differences. Axonal staining for myelin (a), parvalbumin (b), and neurofilament H (e) show a greater number of cross‐sectional axonal profiles in the AcbC compared with the longitudinal profiles observed in AcbSh. The AcbC exhibits a higher intensity neuropil staining for calbindin than the AcbSh (c), while the AchSh exhibits a lower density of calretinin immunopositive neurons than the AcbC (d). The density of vGlut2 immunopositive boutons is lower in the AcbC (f) when compared with the AcbSh (g). In all photomicrographs, medial is to the left of the image and dorsal to the top. Scale bar in (e) = 500 μm and applies to (a)–(e). Scale bar in (g) = 20 μm and applies to (f) and (g). See list for abbreviations
