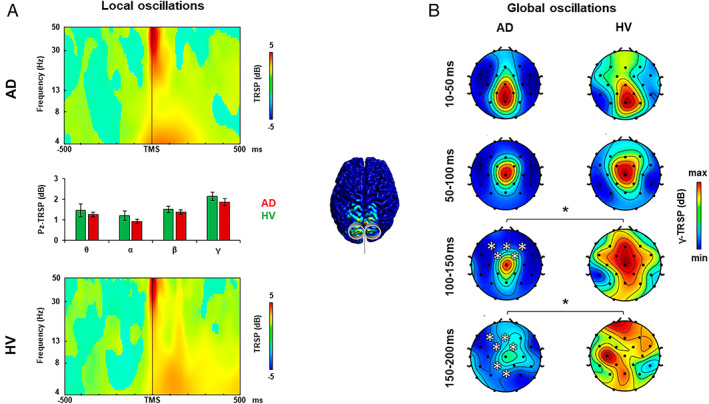
FIGURE 2.

Oscillatory activity analysis after precuneus transcranial magnetic stimulation (TMS). (A) TMS‐related spectral perturbation (TRSP) recorded over the precuneus (PC) in the Alzheimer disease (AD) group (upper plot, red bars) and in the healthy volunteer (HV) group (lower plot, green bars). (B) TRSP with scalp maps of gamma activity recorded over all the scalp after stimulation of the PC in the AD group (left maps) and in the HV group (right maps). Error bars indicate standard error. *p < 0.05. [Color figure can be viewed at www.annalsofneurology.org]
