
FIGURE 5.
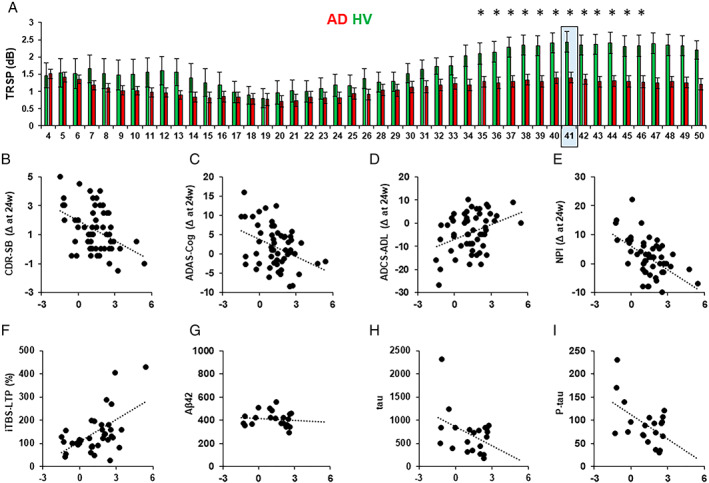
Natural frequency analysis. (A) TMS‐related spectral perturbation (TRSP) for each frequency layer after stimulation of the left dorsolateral prefrontal cortex (l‐DLPFC). Red bars depict the TRSP in the Alzheimer disease (AD) group; green bars depict the TRSP in the healthy volunteer (HV) group. Light blue squares indicate the natural frequency. Error bars indicate standard error. *p < 0.05. (B–E) Linear relations between the natural frequency of the l‐DLPFC (l‐DLPFC‐NF) and the clinical scores change after 24 weeks from the first evaluation in the (B) Clinical Dementia Rating Scale Sum of Boxes (CDR‐SB; score range: 0–18, higher scores indicate worsening; r = −0.42, p = 0.001), (C) The Alzheimer's Disease Assessment Scale–Cognitive Subscale (ADAS‐Cog; score range: 0–70, higher scores indicate worsening; r = −0.389, p = 0.003), (D) Alzheimer's Disease Cooperative Study–Activities of Daily Living (ADCS‐ADL; score range: 0–78, lower scores indicate worsening; r = −0.365, p = 0.006), (E) Neuropsychiatric Inventory (NPI; score range: 0–144, higher scores indicate worsening; r = −0.414, p = 0.002). (F–I) Linear relations between the natural frequency of the l‐DLPFC and levels of (F) percentage of long‐term potentiation–like plasticity measured with intermittent theta‐burst stimulation (iTBS‐LTP; r = 0.447, p = 0.005), (G) amyloid‐beta (Aβ; r = −0.239, p = 0.148), (H) tau (r = −0.378, p = 0.04), and (I) p‐tau (r = −0.39, p = 0.04). [Color figure can be viewed at www.annalsofneurology.org]