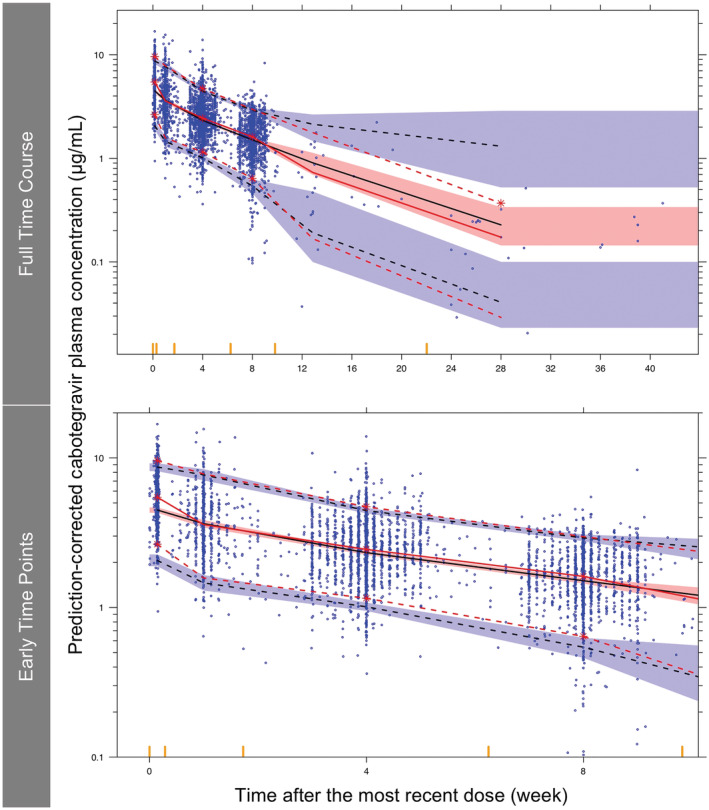
FIGURE 7.

External validation of the final model using prediction‐corrected visual predictive check. Red solid line, median of prediction‐corrected observations; red dashed lines, 5th and 95th percentiles of prediction‐corrected observations; black dashed lines, predicted median, 5th and 95th percentiles; shaded regions, 95% confidence interval of the predicted median (pink), 5th and 95th percentiles (blue); blue dots, prediction‐corrected observations; red asterisks, prediction‐corrected observation lines were not contained within the shaded region; yellow bars on the x axis, boundaries between bins
