
Figure 2. In vitro characterization of AuNS loaded with DNA.
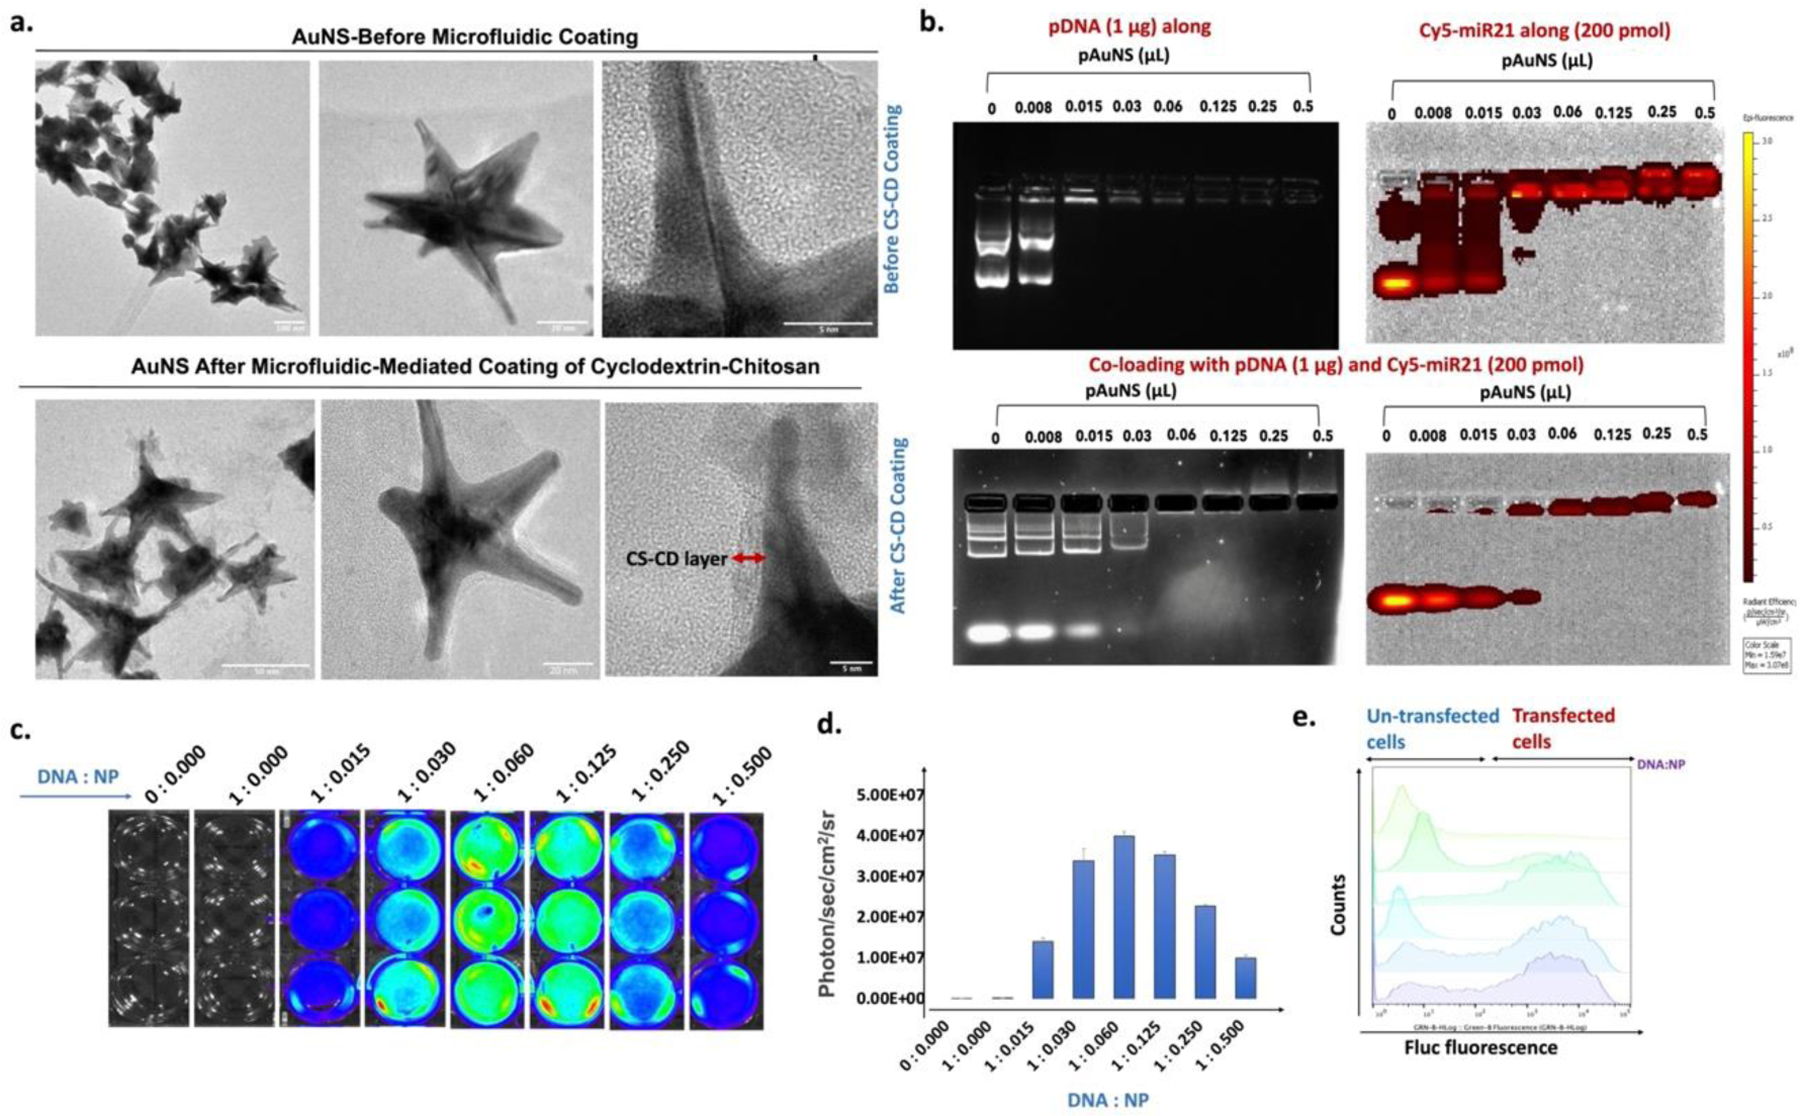
(a) Transmission electron microscopy (TEM) images showing uniform morphology of AuNS before and after microfluidic-mediated coating of CS-CD; Scale bar:100 nm (upper-left panel), 20 nm (upper-middle panel), 5 nm (upper-right panel), 50 nm (lower-left panel), 20 nm (lower-middle panel), and 5 nm (lower-right panel). (b) Optimization of DNA/miR to NPs ratio measured using a gel retardation assay for the co-loading of Cy-5-tagged miR and TK-p53-NTR plasmid DNA; (c) Transfection efficiency of pAuNS- loaded Fluc-eGFP-pcDNA plasmid (pAuNS@eGFG-pcDNA) estimated by bioluminescence imaging; (d) Quantitative graph showing the transfection efficiency measured in “c” (n=3, the data are presented as mean ± SEM); and (e) Flow cytometry analysis measuring the in vitro transfection efficiency of Fluc-eGFP-pcDNA delivered by pAuNS in different N/P ratio by the expressed GFP signal.