
FIGURE 1.
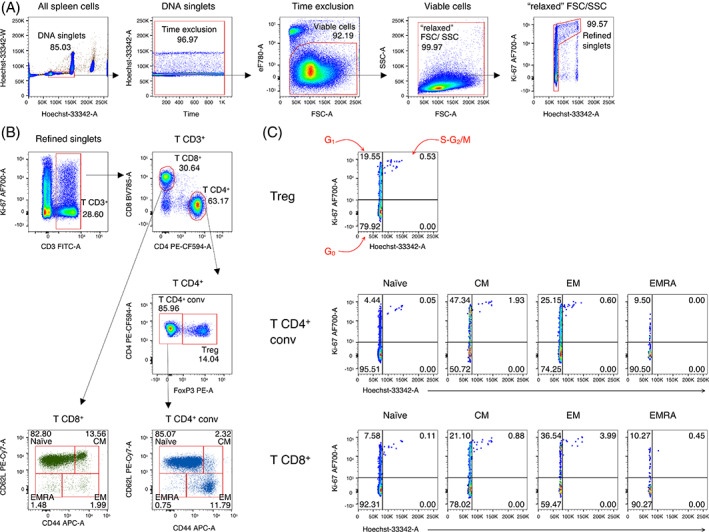
Cell cycle analysis of mouse T cell subsets. Example of analysis of spleen cells from a 3‐months old C57BL/6J mouse, using manual gating strategy. (A) Refined gating of viable single cells from the spleen in five steps: (1) DNA singlets. Single cells having 2n ≤ DNA content ≤4n were selected on the Hoechst‐33342 area (A) versus (vs) Hoechst‐33342 width (W) plot; (2) time exclusion. Stable acquisition over time (seconds) was monitored on the time vs Hoechst‐33342‐A plot and any events collected in case of pressure fluctuations were excluded; (3) viable cells. Live cells were selected using FSC‐A vs eFluor 780 (eF780) viability dye; (4) FSC/SSC “relaxed” gate. A “relaxed” gate was used on the FSC‐A vs SSC‐A plot, to include highly activated and cycling lymphocytes [19]; (5) refined singlets. A few remaining doublets composed by one cell sitting on top of another (so called “shadow” doublets) were excluded as Ki‐67int/− events having >2n DNA content [20]. This gating strategy was used as a base for the subsequent gates. (B) CD3+ T cells were gated on CD3‐A vs Ki‐67‐A plot, then CD4+ and CD8+ T cells on CD4‐A vs CD8‐A plot. CD4+ Treg cells were distinguished based on their FoxP3 expression from conventional FoxP3− CD4+ T cells. Subsequently, the following naïve/memory subsets of conventional CD4+ T cells were identified: CD44int/lowCD62L+ naïve, CD44highCD62L+ central memory (CM), CD44highCD62L− effector memory (EM), and CD44int/lowCD62L− EMRA. Similarly, naïve/memory subsets were identified among CD8+ T cells. (C) Cell cycle phases of Treg cells and of naïve/memory CD4+ and CD8+ T cell subsets were defined on Hoechst‐33342‐A vs Ki67‐A plot as follows: Cells in G0 were identified as DNA 2n/ Ki67− (bottom left quadrant); cells in G1 as DNA 2n/ Ki67+ (upper left quadrant); cells in S‐G2/M as DNA > 2n/ Ki67+ (top right quadrant) [Color figure can be viewed at wileyonlinelibrary.com]