Figure 2.
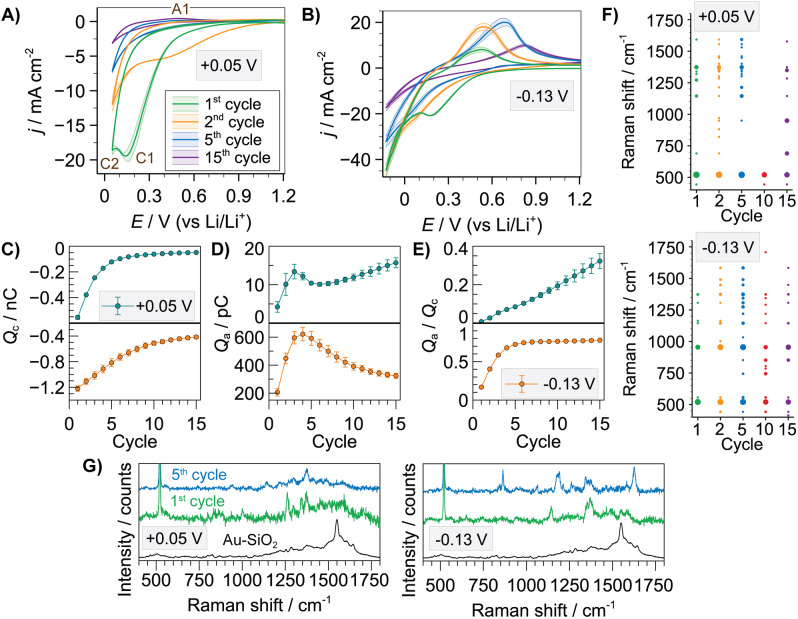
Averaged SECCM CVs (n=11) for 1, 2, 5 and 15 charge/discharge cycles in 1 M LiPF6 in PC with a cut‐off voltage of +0.05 V (A) or −0.13 V vs. Li/Li+ (B). Evolution of cathodic (Q c) (C), anodic (Q a) (D) charges and Q a/Q c ratio (E) as a function of charge/discharge cycle. F) List of all Raman bands detected for the entire set of SECCM locations as a function of cycle number and SOC. Dot size represents the incidence number for a specific Raman band. G) Raman spectra for Au‐SiO2 SHINs and SEI formed upon 1 and 5 charge/discharge cycles under low and high SOC on Si wafer (note band at 520 cm−1 is from silicon wafer).

