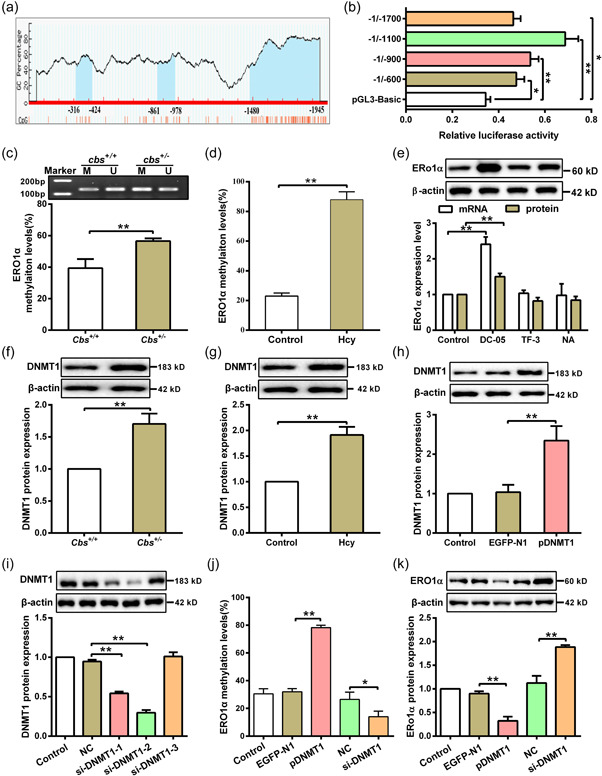
Figure 3.

Hcy inhibits ERO1α expression through DNA methylation. (a) Bioinformatics was used to analyze the methylation sites of ERO1α promoter from −2000 to −1 region on the MethPrimer website (http://www.urogene.org/cgi-bin/methprimer/methprimer.cgi), and the predicted CpG islands were indicated by blue color. (b) Several fragments (−1 to −600, −1 to −900, −1 to −1100, −1 to −1700) of the ERO1α promoter were cloned into a pGL3‐basic reporter vector and cotransfected with a Renilla reporter plasmid in HEK293T cells, and the ERO1α promoter activity was analyzed by dual‐luciferase reporter assay (n = 3). (c) Methylation levels of ERO1α promoter in liver tissues from cbs +/ − and cbs +/+ mice were detected by nMS‐PCR after bisulfite modification of the DNA (n = 6). M: methylation; U: unmethylation. (d) MassARRAY methylation analysis was used to measure the methylation level of ERO1α promoter in hepatocytes cells treated with 100 μM Hcy (n = 3). (e) The mRNA and protein expression of ERO1α were determined by qRT‐PCR and western blot in hepatocytes treated with DNMT1, DNMT3a, and DNMT3b specific inhibitors (DC‐05, Theaflavin‐3 (TF‐3), and Nanaomycin A (NA), respectively (n = 3). (f) DNMT1 protein expression was analyzed by western blot in liver tissues of cbs +/ − and cbs +/+ mice (n = 6). (G) Protein expression of DNMT1 was analyzed by western blot in hepatocytes treated with Hcy (n = 3). (h) Protein expression of DNMT1 was analyzed in hepatocytes after transfection with negative control vector (EGFP‐N1) or DNMT1‐overexpressed plasmid (pDNMT1) by western blot (n = 3). (i) Western blot was used to detect DNMT1 protein expression in hepatocytes transfected with DNMT1 siRNAs (si‐DNMT1‐1/2/3) (n = 3). (j) ERO1α methylation level was measured with MassARRAY methylation analysis after hepatocytes transfected with pDNMT1 or si‐DNMT1 in the presence of Hcy (n = 3). (k) Protein expression of ERO1α was analyzed by western blot in Hcy‐treated hepatocytes after transfection with pDNMT1 or si‐DNMT1 (n = 3). Data represents mean ± SD, *p < 0.05, **p < 0 .01. DNMT1, DNA methyltransferase 1; ER, endoplasmic reticulum; ERO1α, endoplasmic reticulum oxidoreductase 1α; Hcy, homocysteine; nMS‐PCR, nested methylation‐specific polymerase chain reaction; qRT‐PCR, quantitative real‐time polymerase chain reaction; SD, standard deviation
