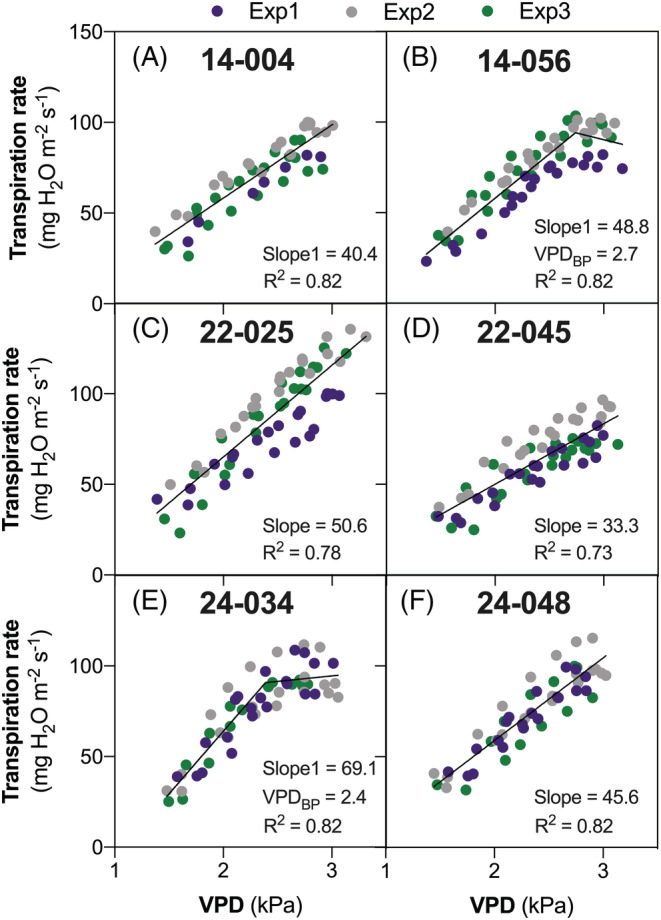
FIGURE 1.

Examples of whole‐plant transpiration rate (TR) response curves to temperature‐independent increases in atmospheric vapor pressure deficit (VPD) for six lines selected from the three families (two lines per family). Panels A–B, C–D, and E–F represent responses of two genotypes from FAM14 (14–004 and 14–056), FAM22 (22–025 and 22–045) and FAM24 (24–034 and 24–048), respectively, including data from all three independent experiments. Linear (slope) and segmented (Slope1, Slope2, VPDBP) regression parameters, along with their coefficients of determination (R2) are indicated.
