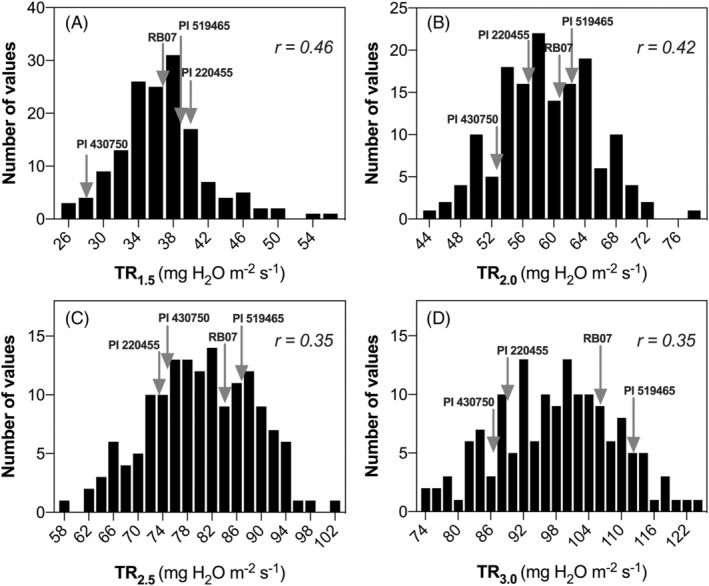
FIGURE 3.

Frequency distribution of the four TR traits. Panels A, B, C, and D represent data for TR1.5, TR2.0. TR2.5 and TR3.0 respectively. In each panel, the values of four parents are highlighted by the gray arrows. Broad sense repeatability (r) values are reported in each panel.
