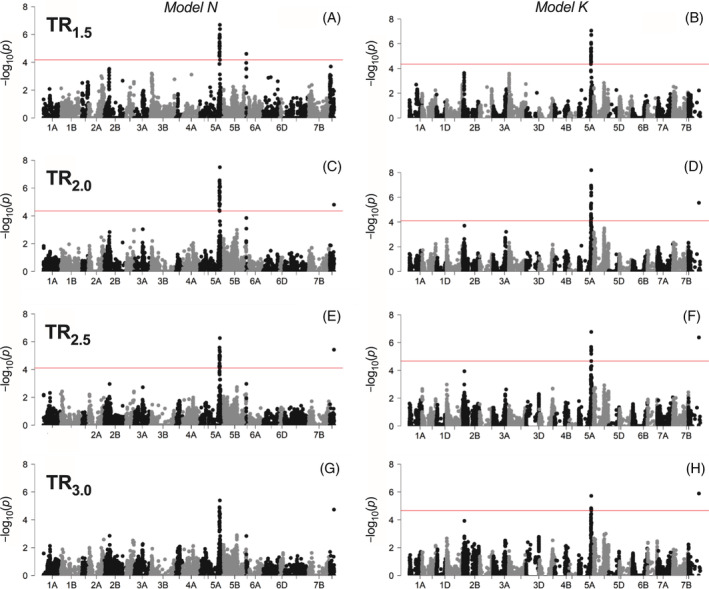
FIGURE 7.

Manhattan plots showing significant SNPs associated with traits controlling transpiration rate (TR) response to increasing vapor pressure deficit (VPD). Results are shown based on two genome‐wide association models, N (left) and K (right) for TR1.5 (A, B), TR2.0 (C, D), TR2.5 (E, F) and TR3.0 (G, H). In each panel (except G), the horizontal line indicates the threshold level above which SNPs are declared as significantly associated with the trait with an FDR of 0.05.
