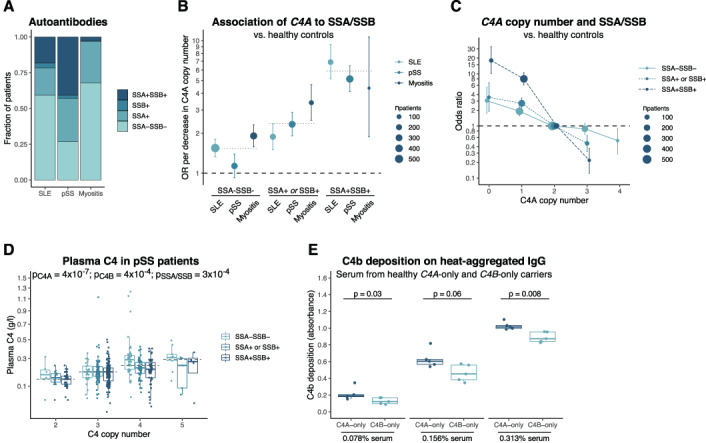
Figure 2.

Association between C4 copy number and anti‐SSA/SSB autoantibodies. A, Prevalence of anti‐SSA/anti‐SSB autoantibodies in patients with SLE (n = 919), primary SS (n = 902), or myositis (n = 364). B, Logistic regression analysis of association between each decrease in C4A copy number and anti‐SSA/anti‐SSB autoantibody status among each patient group compared to healthy controls. Dotted lines indicate ORs for association in the combined group of 3 diseases. C, Logistic regression analysis of association between C4A copy number and anti‐SAA/anti‐SSB autoantibody status in the combined patient group compared to healthy controls. In B and C, bars represent 95% confidence intervals, and models have been adjusted for presence of C4B, sex, and PC1–PC4. D, Plasma C4 levels in patients with primary SS. Groups were compared by analysis of variance with square root–transformed values for the C4 concentration, adjusted for sex and cohort (n = 470). C4A and C4B copy number was included in the model; the x‐axis shows total C4 copy number for simplicity. E, Deposition of the complement activation product C4b on heat‐aggregated human IgG, analyzed with varying concentrations of serum from healthy individuals carrying C4A genes only (n = 5) or C4B genes only (n = 5). The samples were analyzed ≥3 times, and the mean absorbance for each sample was evaluated using the Mann‐Whitney U test. In D and E, Data are shown as box plots. Each box represents the 25th to 75th percentiles. Lines inside the boxes represent the median, and whiskers extend to 1.5 times the interquartile range. See Figure 1 for other definitions. Color figure can be viewed in the online issue, which is available at http://onlinelibrary.wiley.com/doi/10.1002/art.42122/abstract.
