
FIGURE 3.
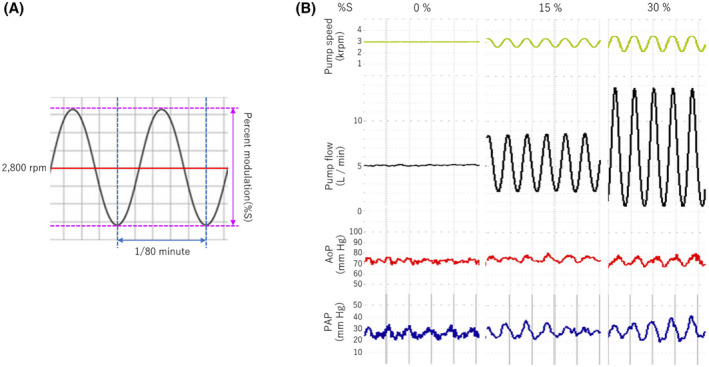
(A) Depiction of a generated sinusoidal wave. (B) Actual waveforms of pump speed, pump flow, aortic pressure (AoP), and pulmonary artery pressure (PAP) with percent modulation (%S) of 0%, 15%, and 30%
Official websites use .gov
A
.gov website belongs to an official
government organization in the United States.
Secure .gov websites use HTTPS
A lock (
) or https:// means you've safely
connected to the .gov website. Share sensitive
information only on official, secure websites.
(A) Depiction of a generated sinusoidal wave. (B) Actual waveforms of pump speed, pump flow, aortic pressure (AoP), and pulmonary artery pressure (PAP) with percent modulation (%S) of 0%, 15%, and 30%