
FIGURE 4.
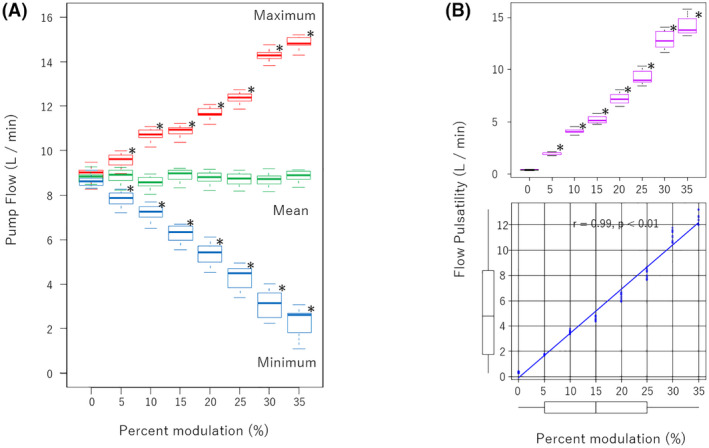
(A) Pump flow with different percent modulation (%S). (B) top: Flow pulsatility versus %S. bottom: Correlation between flow pulsatility and %S analyzed with Spearman's rank correlation coefficient. *p < 0.01 compared with 0% of %S
Official websites use .gov
A
.gov website belongs to an official
government organization in the United States.
Secure .gov websites use HTTPS
A lock (
) or https:// means you've safely
connected to the .gov website. Share sensitive
information only on official, secure websites.
(A) Pump flow with different percent modulation (%S). (B) top: Flow pulsatility versus %S. bottom: Correlation between flow pulsatility and %S analyzed with Spearman's rank correlation coefficient. *p < 0.01 compared with 0% of %S