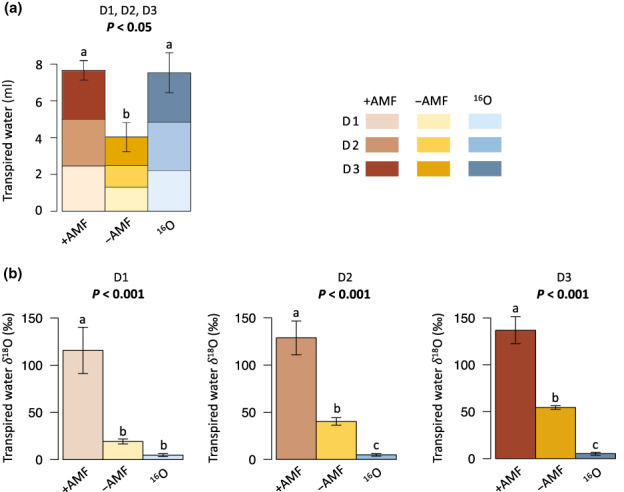
Fig. 3.

Volume (a) and isotope enrichment (b) of water transpired by Avena barbata shoots over 3 d (Day(D)1, 2, 3) in +AMF, −AMF and 16O microcosms. Each color and shade (light, medium, dark) represents 1 d of water transpired. In (a, b), different letters above bars represent statistically significant differences (one‐way ANOVA & Fisher LSD test); corresponding P‐values are indicated above each plot. The error bars represent SE (n = 18). AMF, arbuscular mycorrhizal fungi.
