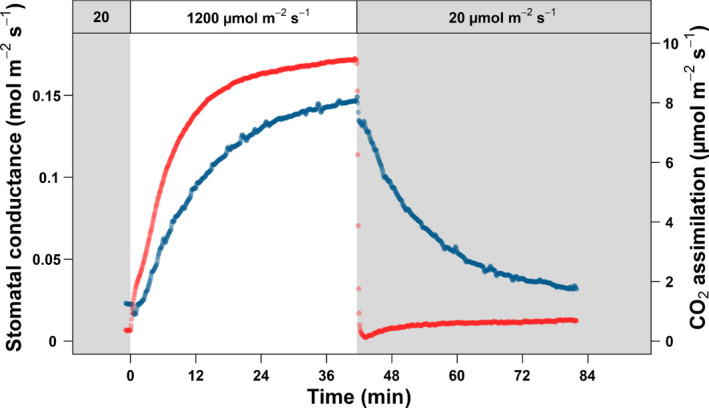
Fig. 1.

Example of a time course of light induction by a sunfleck. The example curve shown here was recorded on a sun leaf at the top of the canopy, from the Fagus sylvatica Swedish provenance. The CO2 assimilation and stomatal conductance are shown in red and blue, respectively. The grey and white area represent periods of low (20 μmol m−2 s−1) and high (1200 μmol m−2 s−1) irradiance, respectively.
