Fig. 1.

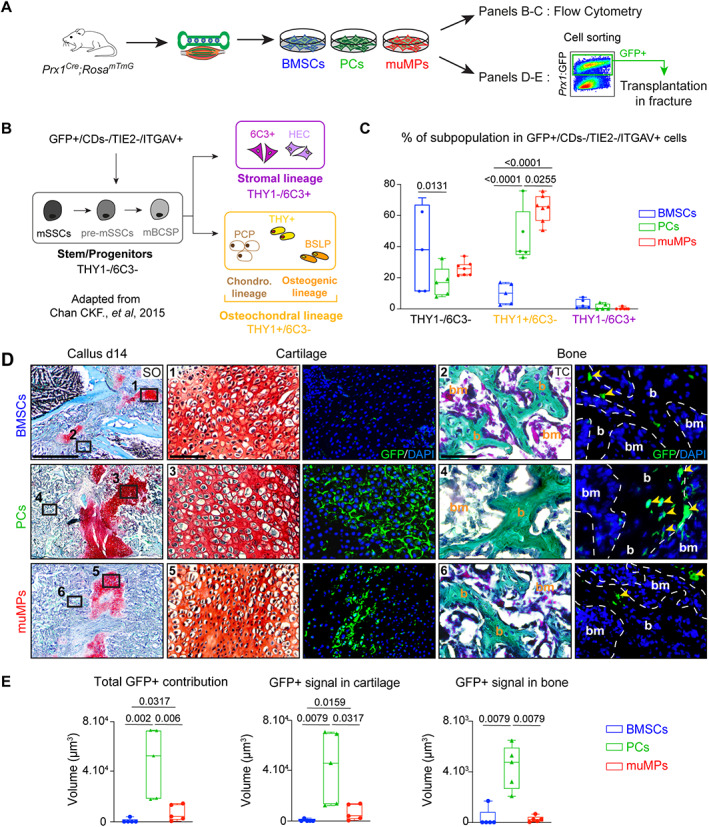
Periosteum‐derived and skeletal muscle‐derived cells are enriched in osteochondral progenitors and contribute efficiently to endochondral ossification during bone repair. (A) Experimental design. BMSCs, PCs, and skeletal muMPs were isolated from Prx1 Cre ;Rosa mTmG mice and cultured for one passage before flow cytometry analyses or cell sorting based on GFP expression prior to cell transplantation at the fracture site. (B) Schematic representation of hierarchical organization of skeletal stem/progenitor cells adapted from.( 38 ) Prx1‐derived GFP+ cells were gated first; hematopoietic and endothelial cells were excluded (CDs‐ = TER119−/CD45−/TIE2−) and ITGAV+ cells were included in the analysis. THY1 and 6C3 markers expression allow the identification of stem/progenitors (THY1−/6C3−), osteochondral (THY1+/6C3−) and stromal (THY1−/6C3+) subpopulations. (C) Percentage of skeletal stem/progenitor, osteochondral, and stromal cells in Prx1‐derived GFP+ BMSCs, PCs, and muMPs (n = 5–7 cell cultures per group). (D) Left, Longitudinal sections of fracture callus at d14 post‐fracture stained by SO. Middle‐right, High magnifications of boxed areas in cartilage and bone stained by SO and TC, respectively, and adjacent sections counterstained with DAPI (bone is delimited by a white dotted line). Boxed areas 1 and 2 showing limited contribution of BMSCs to cartilage and bone, boxed areas 3 and 4 showing robust contribution of PCs to cartilage and bone, and boxed areas 5 and 6 showing contribution of muMPs to cartilage and limited contribution to bone. Yellow arrowheads indicate contribution of transplanted cells to bone. (E) Histomorphometric quantification of total GFP+ signal and GFP+ signal in cartilage and bone, respectively. (C) Each dot represents an independent cell culture; (E) each dot represents a single animal. Values represent the median and interquartile range. (C) Exact p value calculated by two‐way ANOVA followed by Tukey test. (E) n = 5 per group, exact p value calculated with one‐way ANOVA followed by two‐sided Mann‐Whitney test. Scale bars: SO low magnification= 1 mm, cartilage high magnification = 200 μm, bone high magnification = 50 μm. b = bone; bm = bone marrow; BMSC = bone marrow stromal cell; muMP = muscle mesenchymal progenitor; PC = periosteal cell; SO = Safranin O; TC = trichrome.
