Fig. 4.

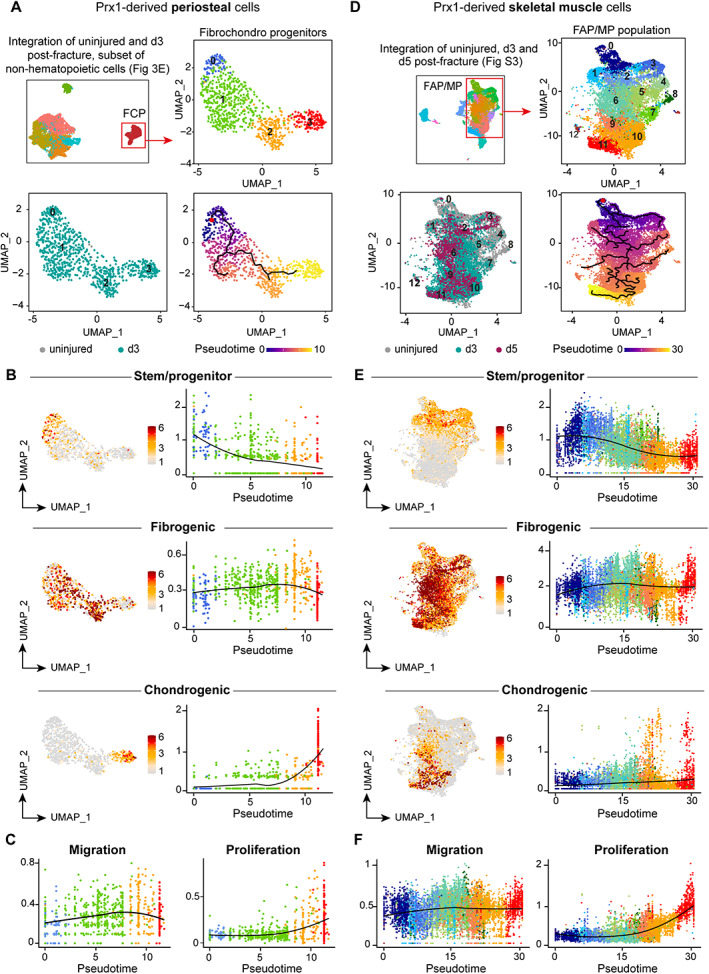
Single‐cell RNAseq reveals similar activation patterns of periosteum and muscle progenitors after bone fracture. (A) Top left, UMAP projection of subclusterization of non‐hematopoietic PCs as in Fig. 3E. Top right, UMAP projection of FCPs used for the subsequent analyses. Bottom left, UMAP visualization of sample origin of FCPs (uninjured in gray and d3 post‐fracture in green). Bottom right, Pseudotime trajectory analysis of periosteum‐derived FCPs. (B) Feature plot and scatter plot of stem/progenitor (top), fibrogenic (middle), and chondrogenic (bottom) lineage scores along pseudotime in periosteum derived FCPs. (C) Scatter plot of migration and proliferation lineage scores along pseudotime in FCPs. (D) Top left, UMAP projection of Prx1‐derived skeletal muscle cells from uninjured tissue and from d3 and d5 post‐fracture samples as in Fig. S4. Top right, UMAP projection of subclusterization of Prx1‐derived skeletal muscle FAP/MP used for the subsequent analyses. Bottom left, UMAP visualization of sample origin of Prx1‐derived skeletal muscle FAP/MP (uninjured in gray, d3 post‐fracture in green and d5 post‐fracture in purple). Bottom right, Pseudotime trajectory analysis of Prx1‐derived skeletal muscle FAP/MP. (E) Feature plot and scatter plot of stem/progenitor (top), fibrogenic (middle), and chondrogenic (bottom) lineage scores along pseudotime in FAP/MP. (F) Scatter plot of migration and proliferation lineage scores along pseudotime in FAP/MP. Color scheme used in B and C corresponds to the color of clusters used in A, and color scheme used in and E and F corresponds to the color of clusters used in D. d3 = day 3; FAP = fibroadipogenic progenitor; FCP = fibrochondro progenitor; MP = mesenchymal progenitor; PC = periosteal cell; UMAP = uniform manifold approximation and projection.
