
Fig. 5.
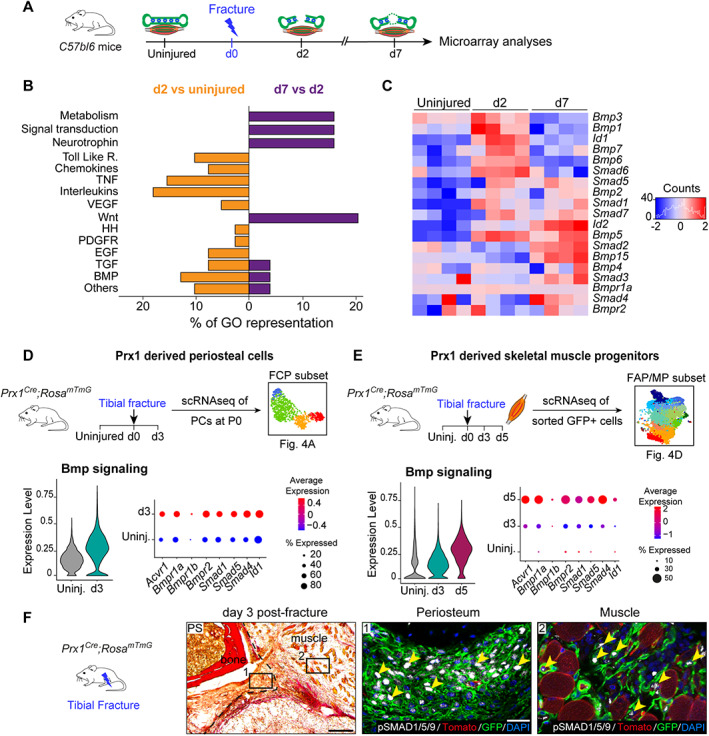
BMP signaling is upregulated in injury‐activated periosteum and muscle progenitors. (A) Experimental design of microarray analyses.( 33 ) Tibia and adjacent skeletal muscle were harvested from uninjured hindlimbs at d2 and d7 post‐fracture and used for microarray analyses. (B) Representation of upregulated signaling pathways from Gene Ontology analyses between d2 versus uninjured (in orange, left) and between d7 versus d2 (in purple, right). (C) Heat map of BMP signaling components from microarray dataset. (D,E) Experimental design of scRNAseq of Prx1‐derived periosteal cells and skeletal muscle progenitors. Violin plot of BMP signaling pathway expression (left) and detailed visualization of receptor (Acvr1, Bmpr1a, Bmpr1b, Bmpr2), co‐factor (Smad1, Smad4, Smad5), and target (Id1) gene expression (right) in Prx1‐derived FCPs (D) and skeletal muscle FAP/MP (E). (F) Transverse section of d3 post‐fracture Prx1 Cre ;Rosa mTmG hindlimb stained with PS showing activated periosteum (delimited by a black dotted line). High magnifications of boxed areas from adjacent section counterstained with DAPI show phosphoSMAD1/5/9 positive nuclei (white, pointed with yellow arrowhead) in GFP+ cells (in green) within periosteum (middle), and adjacent skeletal muscle (right). Scale bars: low magnification = 200 μm, high magnification = 50 μm. bm = bone‐marrow; d2 = day 2; PS = Picrosirius.