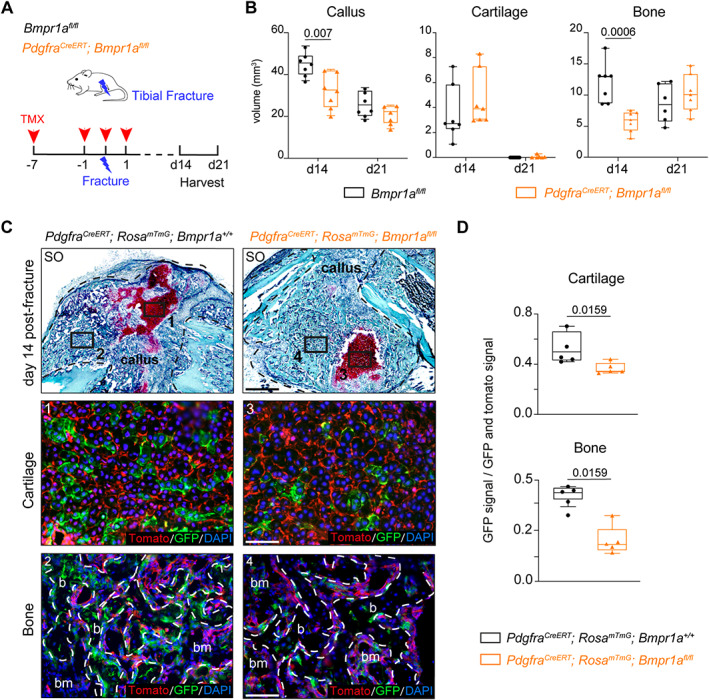
Fig. 6.

Loss of Bmpr1a in Pdgfra‐derived progenitors impairs bone healing. (A) Experimental design. Bmpr1a fl/fl (control) and Pdgfra CreERT ;Bmpr1a fl/fl mice were induced with TMX at days 7 and 1 before fracture, day 0 and day 1 post‐fracture. Tibial fractures were induced at d0 and calluses were harvested at d14 and d21 post‐fracture. (B) Histomorphometric quantification of callus, cartilage, and bone volumes at d14 and d21 post‐fracture in Bmpr1a fl/fl control and Pdgfra CreERT ;Bmpr1a fl/fl mutant mice (in black and orange, respectively) (n = 6–7 animals per group). (C) Longitudinal callus sections from Pdgfra CreERT ;Rosa mTmG ;Bmpr1a +/+ control (left) and Pdgfra CreERT ;Rosa mTmG ;Bmpr1a fl/fl mutant (right) mice at d14 post‐fracture stained with SO (callus delimited by a black dotted line). High magnifications of boxed areas of cartilage (1 and 3) and bone (2 and 4) show Pdgfra‐derived cells in cartilage and bone. (D) Quantification of GFP+ signal normalized on total GFP+ and Tomato+ signal in cartilage and bone. n = 4–5 animals per group, each dot represents a single animal. Exact p value calculated with two‐sided Mann‐Whitney test, values represent median and interquartile range. Scale bars: low magnification = 1 mm, high magnification = 200 μm. b = bone; bm = bone‐marrow; d0 = day 0; SO = Safranin O; TMX = tamoxifen.
